| Page 1 | Page 2 | Page 3 | Page 4 | Page 5 |
Lesson #4: What is Slope-Intercept Form?
Now
that we've learned about starting points and rates of change, it's time
to learn about how to plug those things into a linear function.
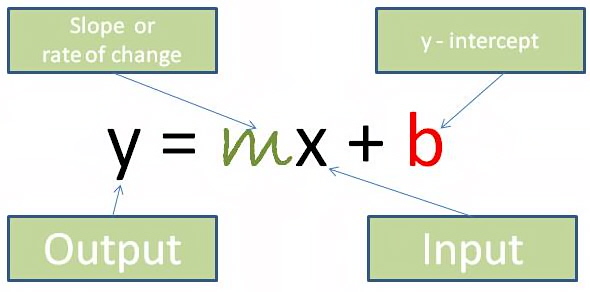
Two things we need to keep in mind,
- Slope and Rate of Change can be used interchangeably. The slope measures the steepness of a linear equation.
- y-intercept is the point where the graph crosses the y-axis, which is the starting point.
- y-intercept is the point where the graph crosses the y-axis, which is the starting point.
So, going back to our example from Lessons 2 and 3, Example #1: You decide to begin a savings account where you will deposit $10 every week. To open a savings account, your local bank requires an initial deposit of $50. | We identified: - Starting point/y-intercept = 50 - Rate of Change/slope = 10 Therefore, the equation for this line would be: y=10x+50 |
When you are ready to move on, go to the next page.