| Page 1 | Page 2 | Page 3 | Page 4 |
Lesson #3: What is a Rate of Change?
Definition: Rate of Change shows how one value changes as a related value changes.
For example: 30 miles per hour means that I increased 30 miles in 1 hour.
| Let's go back to the example we used in the last lesson! Remember about the savings account at the bank? Example #1: You decide to begin a savings account where you will deposit $10 every week. To open a savings account, your local bank requires an initial deposit of $50. If you remember, we determined that the starting point was $50 because it was the beginning value. But what is the rate of change? - Ask yourself: "How does my money change as the time changes?" - My money increases by $10 every time the week increases by 1. - Therefore, the rate of change is written as a fraction $10/1 week. | 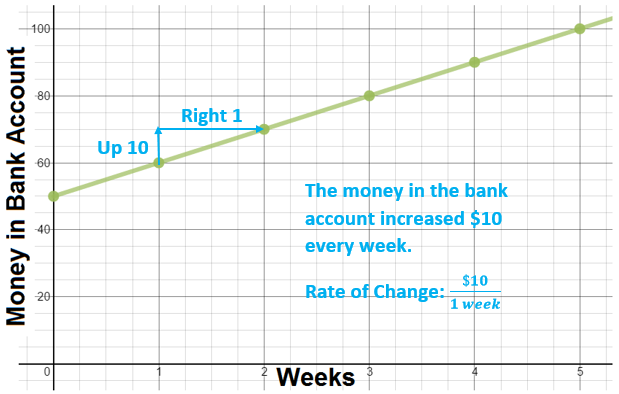
|
TRY THIS ONE ON YOUR OWN!
Let's change up example #2 a bit.
Example #2: You are the President of the Student Council at your high school. At the beginning of the year, you started with 60 members. Unfortunately, every 2 months, you lose 10 members.
Using what you learned from Example #1, what is the rate of change? Is that rate increasing or decreasing?
Think you figured it out?