Pour-through Filters as a Viable Solution to Drinking Water Safety, Aesthetics, and Economics as SIUE
Edward Navarre 
Water Impact at SIUE
Pour-through point-of-use water filters are an important mitigation effort for potentially contaminated drinking water and a resource-aware alternative to bottled water. This study investigates the changes in the efficiency of removing inorganic species of several point-of-use filters under conditions of large total dissolved solids. The study shows that inexpensive pour-through water filters can produce drinking water of similar quality to bottled water.
Introduction
This study was undertaken to address the prevalence of concerns about the quality of the tap water in terms of both health and aesthetic issues, and the significant number of people in the Southern Illinois University Edwardsville (SIUE) community who favored bottled water despite the negative energy and waste consequences. In a 2017 survey of students, faculty and staff at SIUE, over 60 % of respondents identified at least one concern about the safety, health, and cleanliness of the available tap water.1 The presence of lead in tap water was a concern for 84% of respondents. About 25 % of respondents reported drinking mostly or exclusively bottled water and 32% reported using a carbon filter to treat tap water. The racial disparities found in other drinking water quality surveys were reflected in the SIUE survey data.2
The survey results reflect the on-going concern regarding elemental contamination of drinking water. Studies of arsenic in well water indicate wide-spread issues in the conterminous U.S. with risks that may increase with drought conditions.3,4 Excessive concentrations of lead in municipal drinking water occur periodically in the U.S. due to the complex interactions of lead service lines, domestic plumbing fixtures, municipal water disinfection approaches, the chemistry of the source water.5–8
Water aesthetic properties (taste and odor) were also frequently reported in the SIUE study as a reason for preferring bottled water. Drinking water aesthetics have contributions from organic and inorganic species. This study was limited to inorganic species of which copper, iron, and sodium are the major contributors.9 Manganese has often been identified as a contributor to taste and odor at small concentrations but more recently its effect has been questioned and appears to require impractically large concentrations (> 75 mg/L) to be perceived by organoleptic methods.10 The typical limits for aesthetic guidance of iron is 0.3 mg/L and 0.4 mg/L for copper.11,12 The importance of inorganic contributors to taste and odor is emphasized by the USEPA’s secondary maximum contaminant levels for Al, Cu, Fe, Mn, Ag, and Zn which are intended to control negative aesthetic effects and promote consumer confidence in the quality of the water.13
An additional concern among those surveyed at SIUE was the amount of waste produced by consuming bottled water and its overall climate impact. The use of bottled water carries much greater total consumption cost than tap water. The energy required to bring bottled water to consumers was estimated between 5 and 10 MJ/L.14 This compares to about 0.0013 MJ/L to 0.013 MJ/L to supply tap water to customers for a surface water source and a desalination source, respectively.15 The energy estimate does not consider the energy cost of the plastic waste generated by bottled water. A life-cycle assessment study of bottled and tap water found that bottled water generated 10 to 20 times more solid waste mass than tap water and 6 to 32 times the greenhouse gas emissions.16
One approach to mitigating the issue of elevated toxic metal concentrations in drinking water, controlling aesthetic quality, and avoiding the excessive energy consumption of bottled water is the broad implementation of point-of-use filters. For people served by public water systems, the point-of-use filter becomes the last phase in an overall purification system that starts at the source water.17,18 For people who rely on private well water, a point-of-use filter may be the only water treatment. Tabletop water filters or pour-through filters present an inexpensive option to improve both the safety and aesthetic qualities of drinking water.19–21 Studies of point-of-use filters indicate some inconsistency in performance and break through of lead phosphate particles under specific conditions.22–24 A longitudinal study of lead removal by solid-block activated carbon point-of-use filters for private well water demonstrated effective removal of lead for at least 250 days under typical residential use conditions.25 These recent studies add to the growing understanding of the actual suitability of point-of-use filters for elemental contamination and the failure modes of these mass-produced filters. The ability of point-of-use filters to enhance drinking water quality is not fully characterized and merits additional study.26 The study presented here aims to add to the understanding of the efficacy of point-of-use filters under conditions that simulate consumer use. In particular, this is a longitudinal study that assesses the changes in filter behavior over the designed capacity of the filters and examines the filtering efficiency when presented with a multi-element spike.
The study presented here examined the tap water available at SIUE and the effects on water quality of using inexpensive pour-through filters. The inorganic water quality properties of tap, filtered tap, and bottled water were evaluated to identify health concerns and contributions to unpleasant aesthetics. The effectiveness of four pour-through water pitcher filters to remove 24 elements from drinking water was assessed. The performance of the filters was monitored over a 3-month period with daily additions of tap water to simulate at-home usage up to and beyond the designed capacity of the filters. Spiked tap water samples were used to assess the capacity of the filters to remove elements during and at the end of their designed capacity. Additionally, several bottled waters readily available to the SIUE community were analyzed to place the water properties of bottled water in context with filtered tap water.
Experimental
Tap water was gathered from a potable water outlet on the SIUE campus which receives its water from a municipal water distribution system. Water was collected in a 25 liter polyethylene carboy and no less than 10 liters were collected each day so that all filters received water from the same aggregate source. The tap water valve was fully opened for no less than 60 seconds prior to collecting to avoid “first draw” bias.27 This approach to water collection resulted in the water in this study being representative of the drinking water as it arrived to the campus but excluded elemental contributions from the corrosion of plumbing fixtures at the outlet.
The water filters selected for this study were granular activated carbon with ion exchange. Three of the filters (CS, OS, and YS) 1 were NSF 42 and 53 certified. The MV filter claims to remove Pb from the water but lacked the NSF certification. All of the filters were pour-through pitcher type filters with a pitcher capacity from 1.5 to 2.0 L. Two sets of the filters were used for the study, divided into two rounds. The first round filtered 1 L of water daily to a total volume of 47 L. The second round filtered 3 L daily to a total of 163 L.
The water filters were prepared according to the manufacturer instructions using tap water and counting the preparation volume toward the total volume. The water pitchers were emptied and refilled daily and stored in a refrigerator at 4 °C to simulate domestic use. Once each week, samples were collected from each filter pitcher and the unfiltered tap water using freshly collected water. Samples destined for elemental analysis were collected in acid-cleaned 250-mL polyethylene bottles and acidified with 2 mL of nitric acid (TraceMetal Grade, Fisher, Waltham, MA). The samples were left at room temperature for 24 hours to promote dissolution of particulates, then stored in a refrigerator until analysis.28 Bottled water samples were similarly acidified in their original bottles and stored until needed. The samples used for bulk water properties were collected directly from the filter pitchers.
The bulk water properties were pH, conductivity, and alkalinity. Each property was measured in duplicate for each sample. The alkalinity was obtained by titrating a 50-mL water sample with approximately 0.4 M H3PO4 until the pH reached 4.0 – 4.5. The change in conductivity, pH, the volume of titrant, and the change in temperature was used to determine alkalinity by an algorithmic method.29 The pH was recorded with an Accumet XL 500 electrode (Fisher Scientific, Waltham, MA) and conductivity with a temperature compensated probe (model 13-620-100, Fisher Scientific, Waltham, MA).
Trace elemental analysis followed the guidance of EPA Method 200.5.30 Water samples were prepared gravimetrically for ICP-OES analysis in acid-cleaned 50-mL polypropylene tubes (10025-708, VWR International, Radnor, PA). Samples were acidified to 2% HCl and 2% HNO3 using Trace Metal Grade acids (Fisher Scientific, Waltham, MA). Calibration was performed with calibrators gravimetrically diluted from a SPEX CertiPrep EPA-SET (SPEX, Metuchen, NJ). Elemental concentrations were determined with an Optima 2100 DV ICP-OES (Perkin Elmer, Waltham, MA). The ICP conditions are given in Table 1.
| RF forward power | 1400 W |
| Tangential Ar flow | 15 L/min |
| Nebulizer Ar flow | 0.7 L/min |
| Auxiliary Ar flow | 0.1 L/min |
| Peristaltic pump sample uptake | 1.5 L/min |
| Nebulizer | SeaSpray (Glass Expansion) |
| Spray chamber | Twister Cyclonic (Glass Expansion) |
| Minimum detector read time | 10 seconds |
| Replicate reads | 5 |
At the end of each round the extraction efficiency of the filters was determined with spiked tap water sample containing a 10000:1 dilution of SPEX Certiprep IPC solutions 5 and 18 containing Ag, Al, As, Ba, Be, Ca, Cd, Co, Cr, Cu, Fe, K, Mg, Mn, Na, Ni, Pb, Se, Tl, V, and Zn (SPEX, Metuchen, NJ). An unfiltered spike was also analyzed and was used as the reference concentration for calculating relative percent removal of elements. The spike elements were all in a soluble form rather than particulate.
Bottled waters were purchased from local stores. The selection of bottled water focused on what was readily available to members of the SIUE community at vendors within a relatively small distance from the campus. Two broad types of bottled waters were purchased: purified water (marked AQ, CR, LW, and SW) and spring water (marked AP, EV, and IM). Purified water is typically produced by reverse osmosis treatment and may have small amounts of inorganic salts added. Spring water is bottled from an aquifer with limited treatment, and has an elemental profile that reflects the geology of the aquifer.
Results
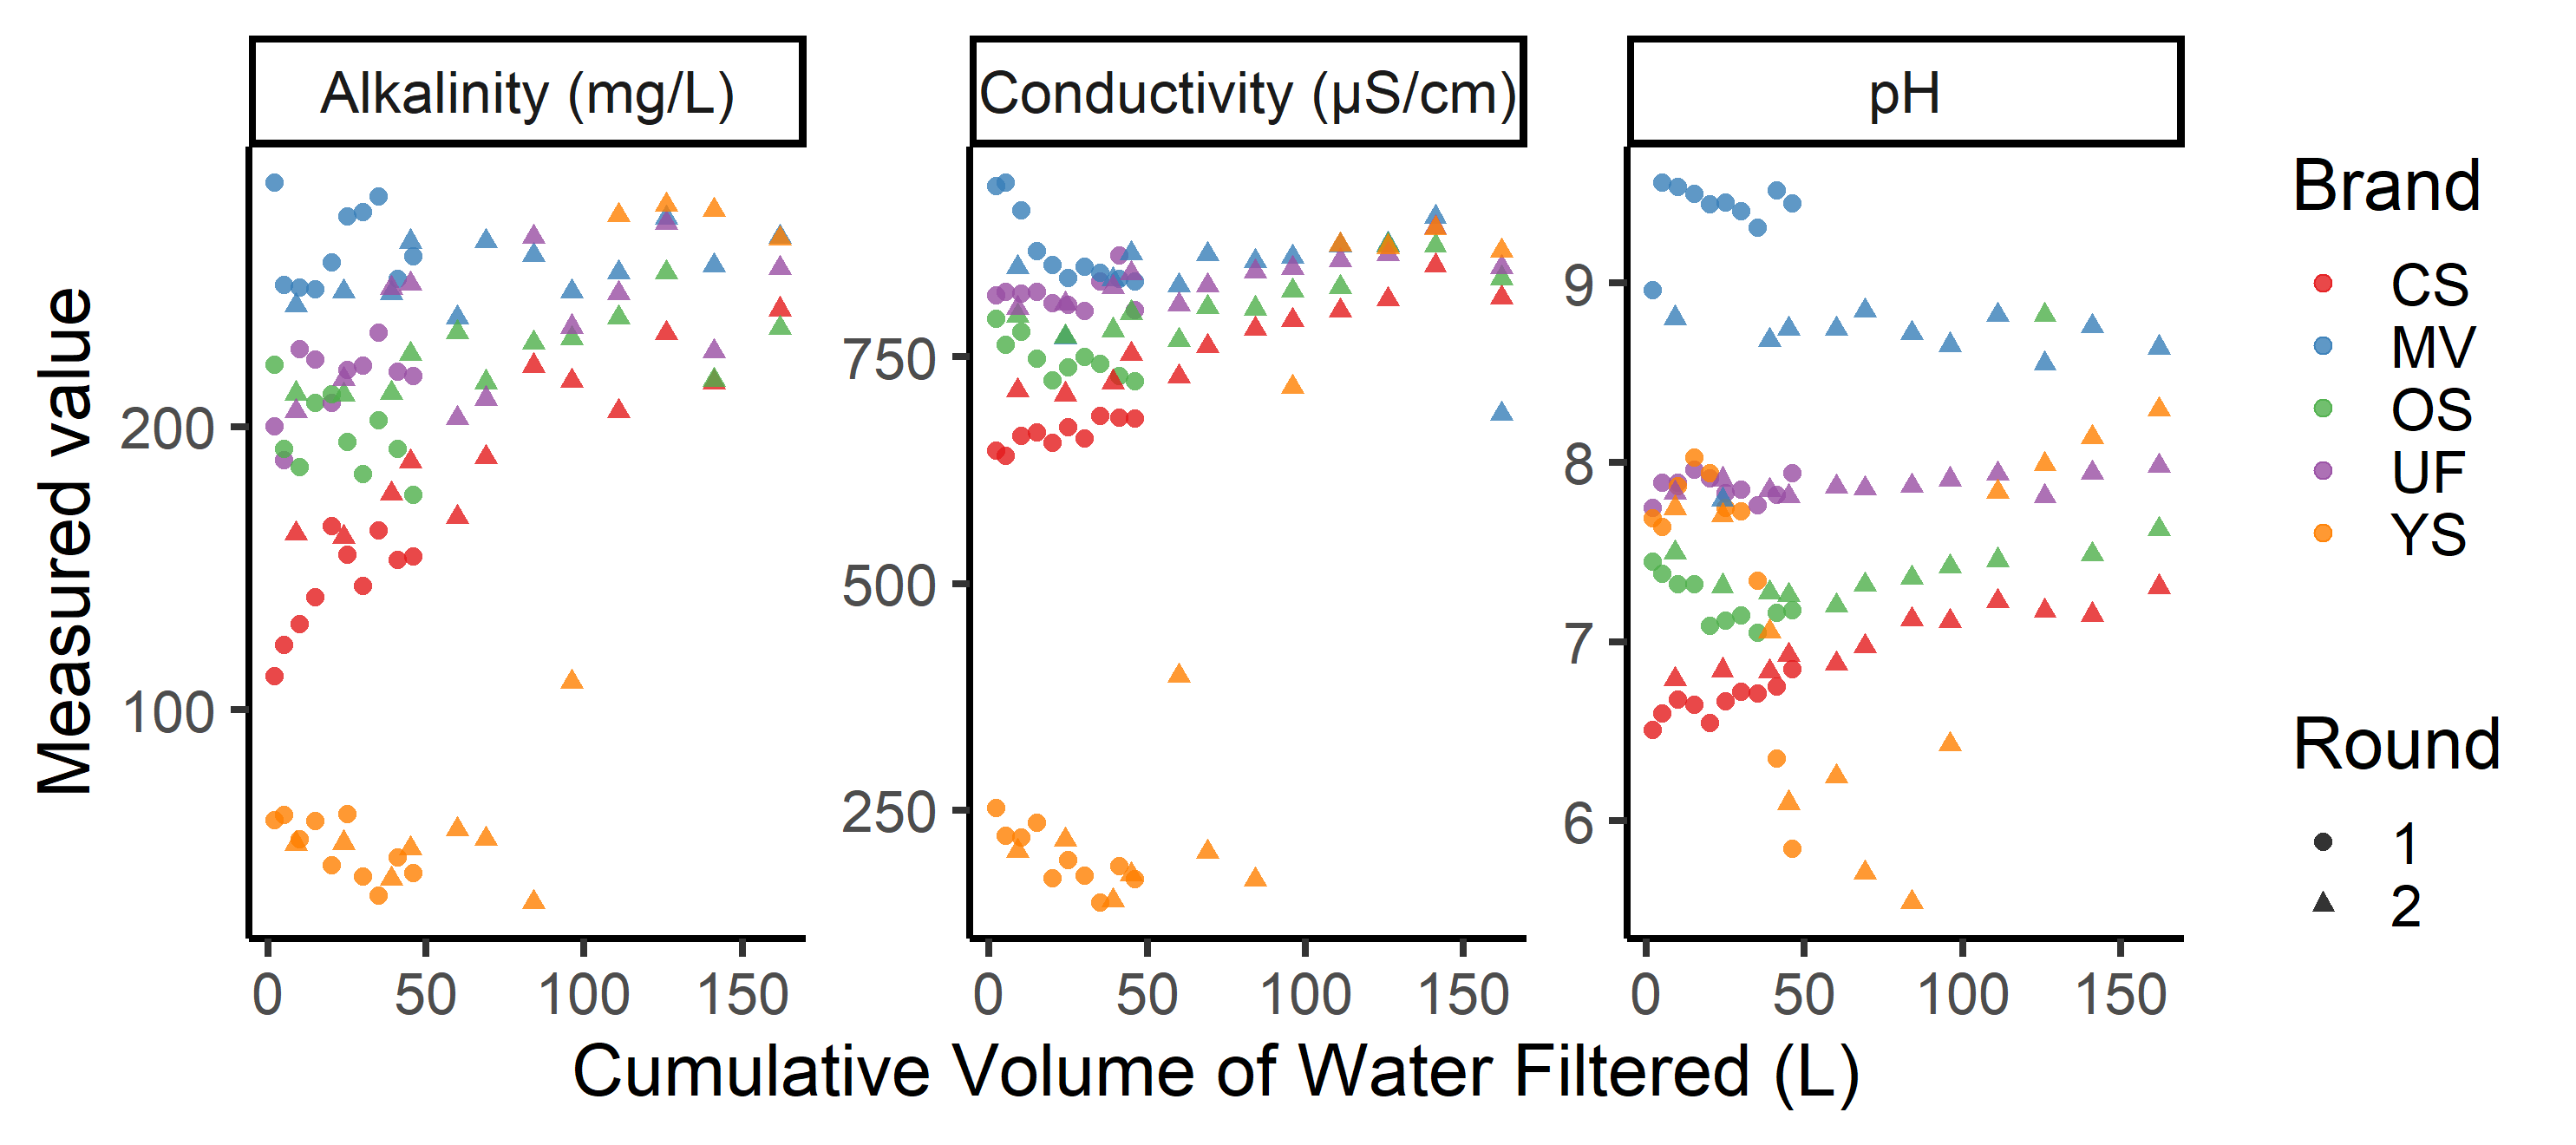
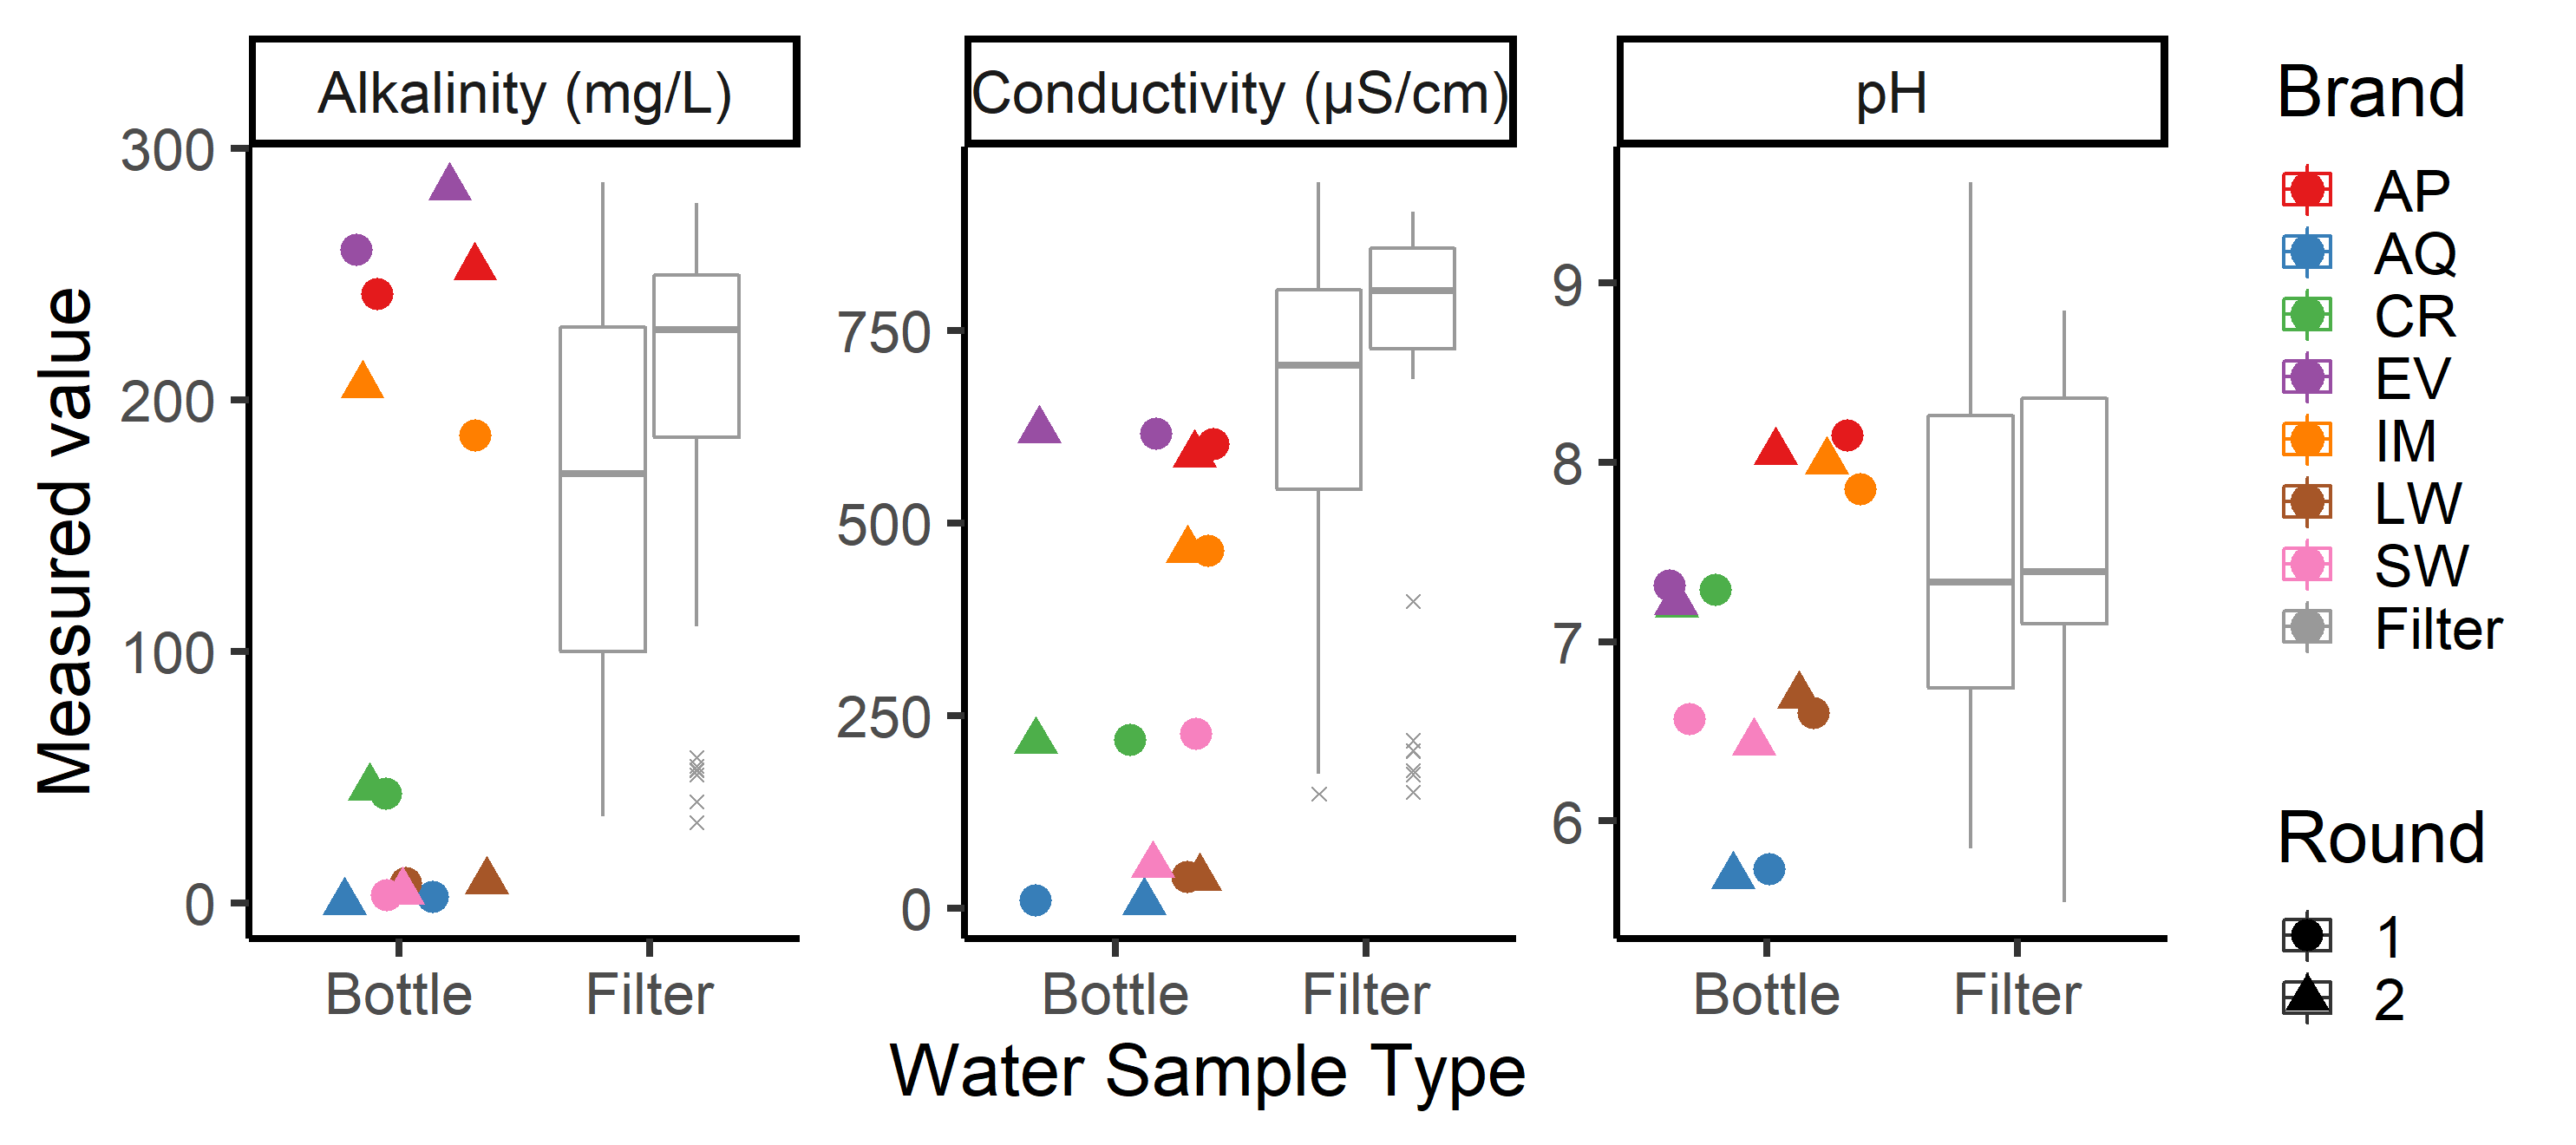
The average alkalinity, conductivity, and pH of the unfiltered water were 227 mg/L as CaCO3, 830 µS/cm, and 7.87, respectively. The water filters modified the pH, conductivity, and alkalinity of the tap water as shown in Figure 1. The MV filter behaved as advertised by the manufacturer to increase the water pH and alkalinity. The filter increased the pH to above 8.5 for the duration of this study. The MV filter’s ability to increase the alkalinity diminished after filtering 70 liters of tap water.
The YS filter manufacturer claims that it reduces the total dissolved solids in the filtered water. This claim is reflected in the greatly reduced conductivity and alkalinity measurements for the YS filter up to about 100 L after which the conductivity is very similar to the unfiltered water (UF). The pH of water from the YS filter initially was indistinguishable from unfiltered; however, after about 40 L filtered the pH decreased by about two units to below 6. The change in pH occurred without large changes to the conductivity or alkalinity. The pH of water from the YS filter later increased to a value similar to that of the unfiltered water at 100 L, coinciding with a large increase in alkalinity and conductivity.
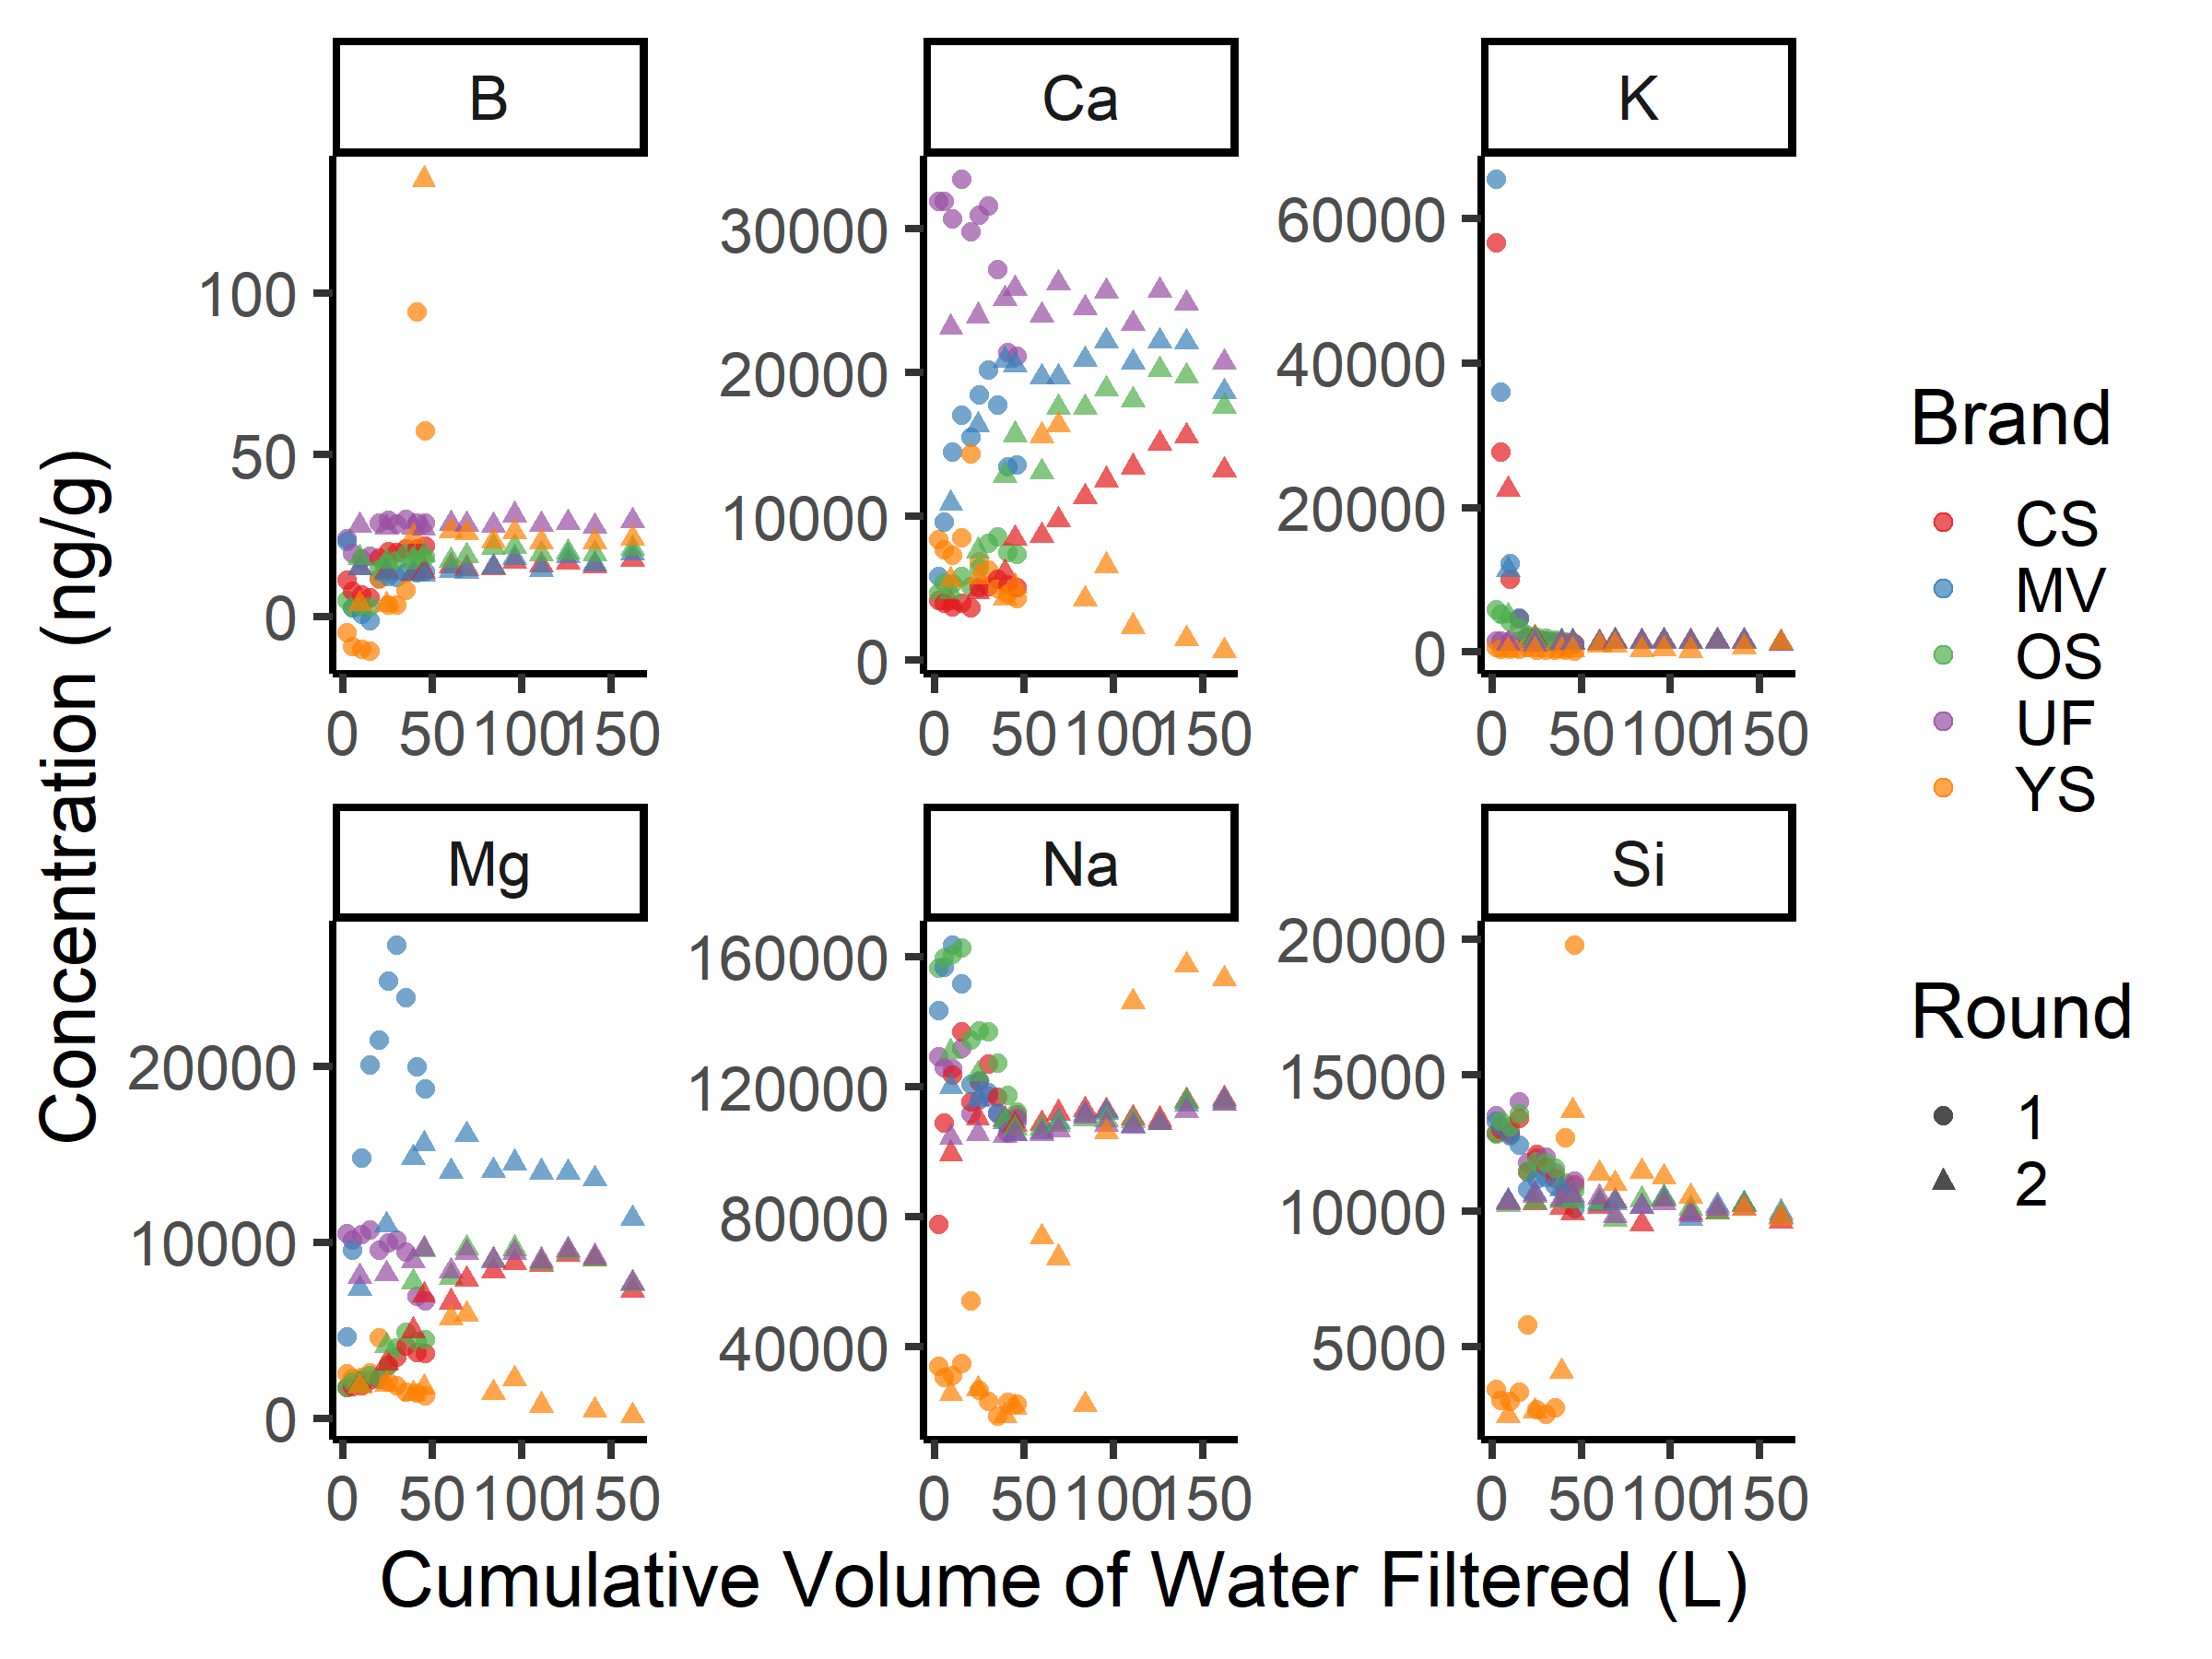
The concentrations of B, Ca, K, Mg, Na, and Si in the drinking water from each filter are shown in Figure 2. These elements are all expected to occur in drinking water at significant concentrations. A large transient increase in the boron and silicon content of water from the YS filter was observed at 41 and 45 L which coincides with the large decrease in pH of water from that filter (Figure 1). Prior to that point, the YS filter removed B and Si very effectively. After 50 L the YS filter loses selectivity for B and Si. The transient increase appears to be due to the release of previously captured B and Si rather than dissolution of a borosilicate component of the filter medium. The YS filter also loses the ability to remove Na from the water at about 100 L and begins to release Na after that cumulative volume. The release of Na appears to be the from accumulated Na in the filter. None of the other filters demonstrated affinity for Na or Si.
Calcium and magnesium were significantly removed from the drinking water by the CS, OS, and YS filters up to about 50 liters. For the CS and OS filters at volumes greater than 50 L, Mg concentrations were indistinguishable from unfiltered water and Ca concentrations increased toward the unfiltered concentration gradually up to the 163 L limit of the study. The YS filter efficiently removed Mg and Ca over the range of volumes in this study.
The MV and CS filters both initially released large concentrations of K into the filtered water. Presumably K is the ion exchanged by the ion exchange resin in these filters. The release of K is exhausted by about 30 L of filtered water. Coinciding with the decrease in released K from the MV filter is an increase in Mg and Na. The release of Mg is a feature of the MV filter described by the manufacturer. Similarly, the OS filter released Na up to 50 L of filtered water. For all three filters (CS, MV, and OS) the cessation of the release of Na and K coincides with a loss of ability to remove Mg and Ca from the water.
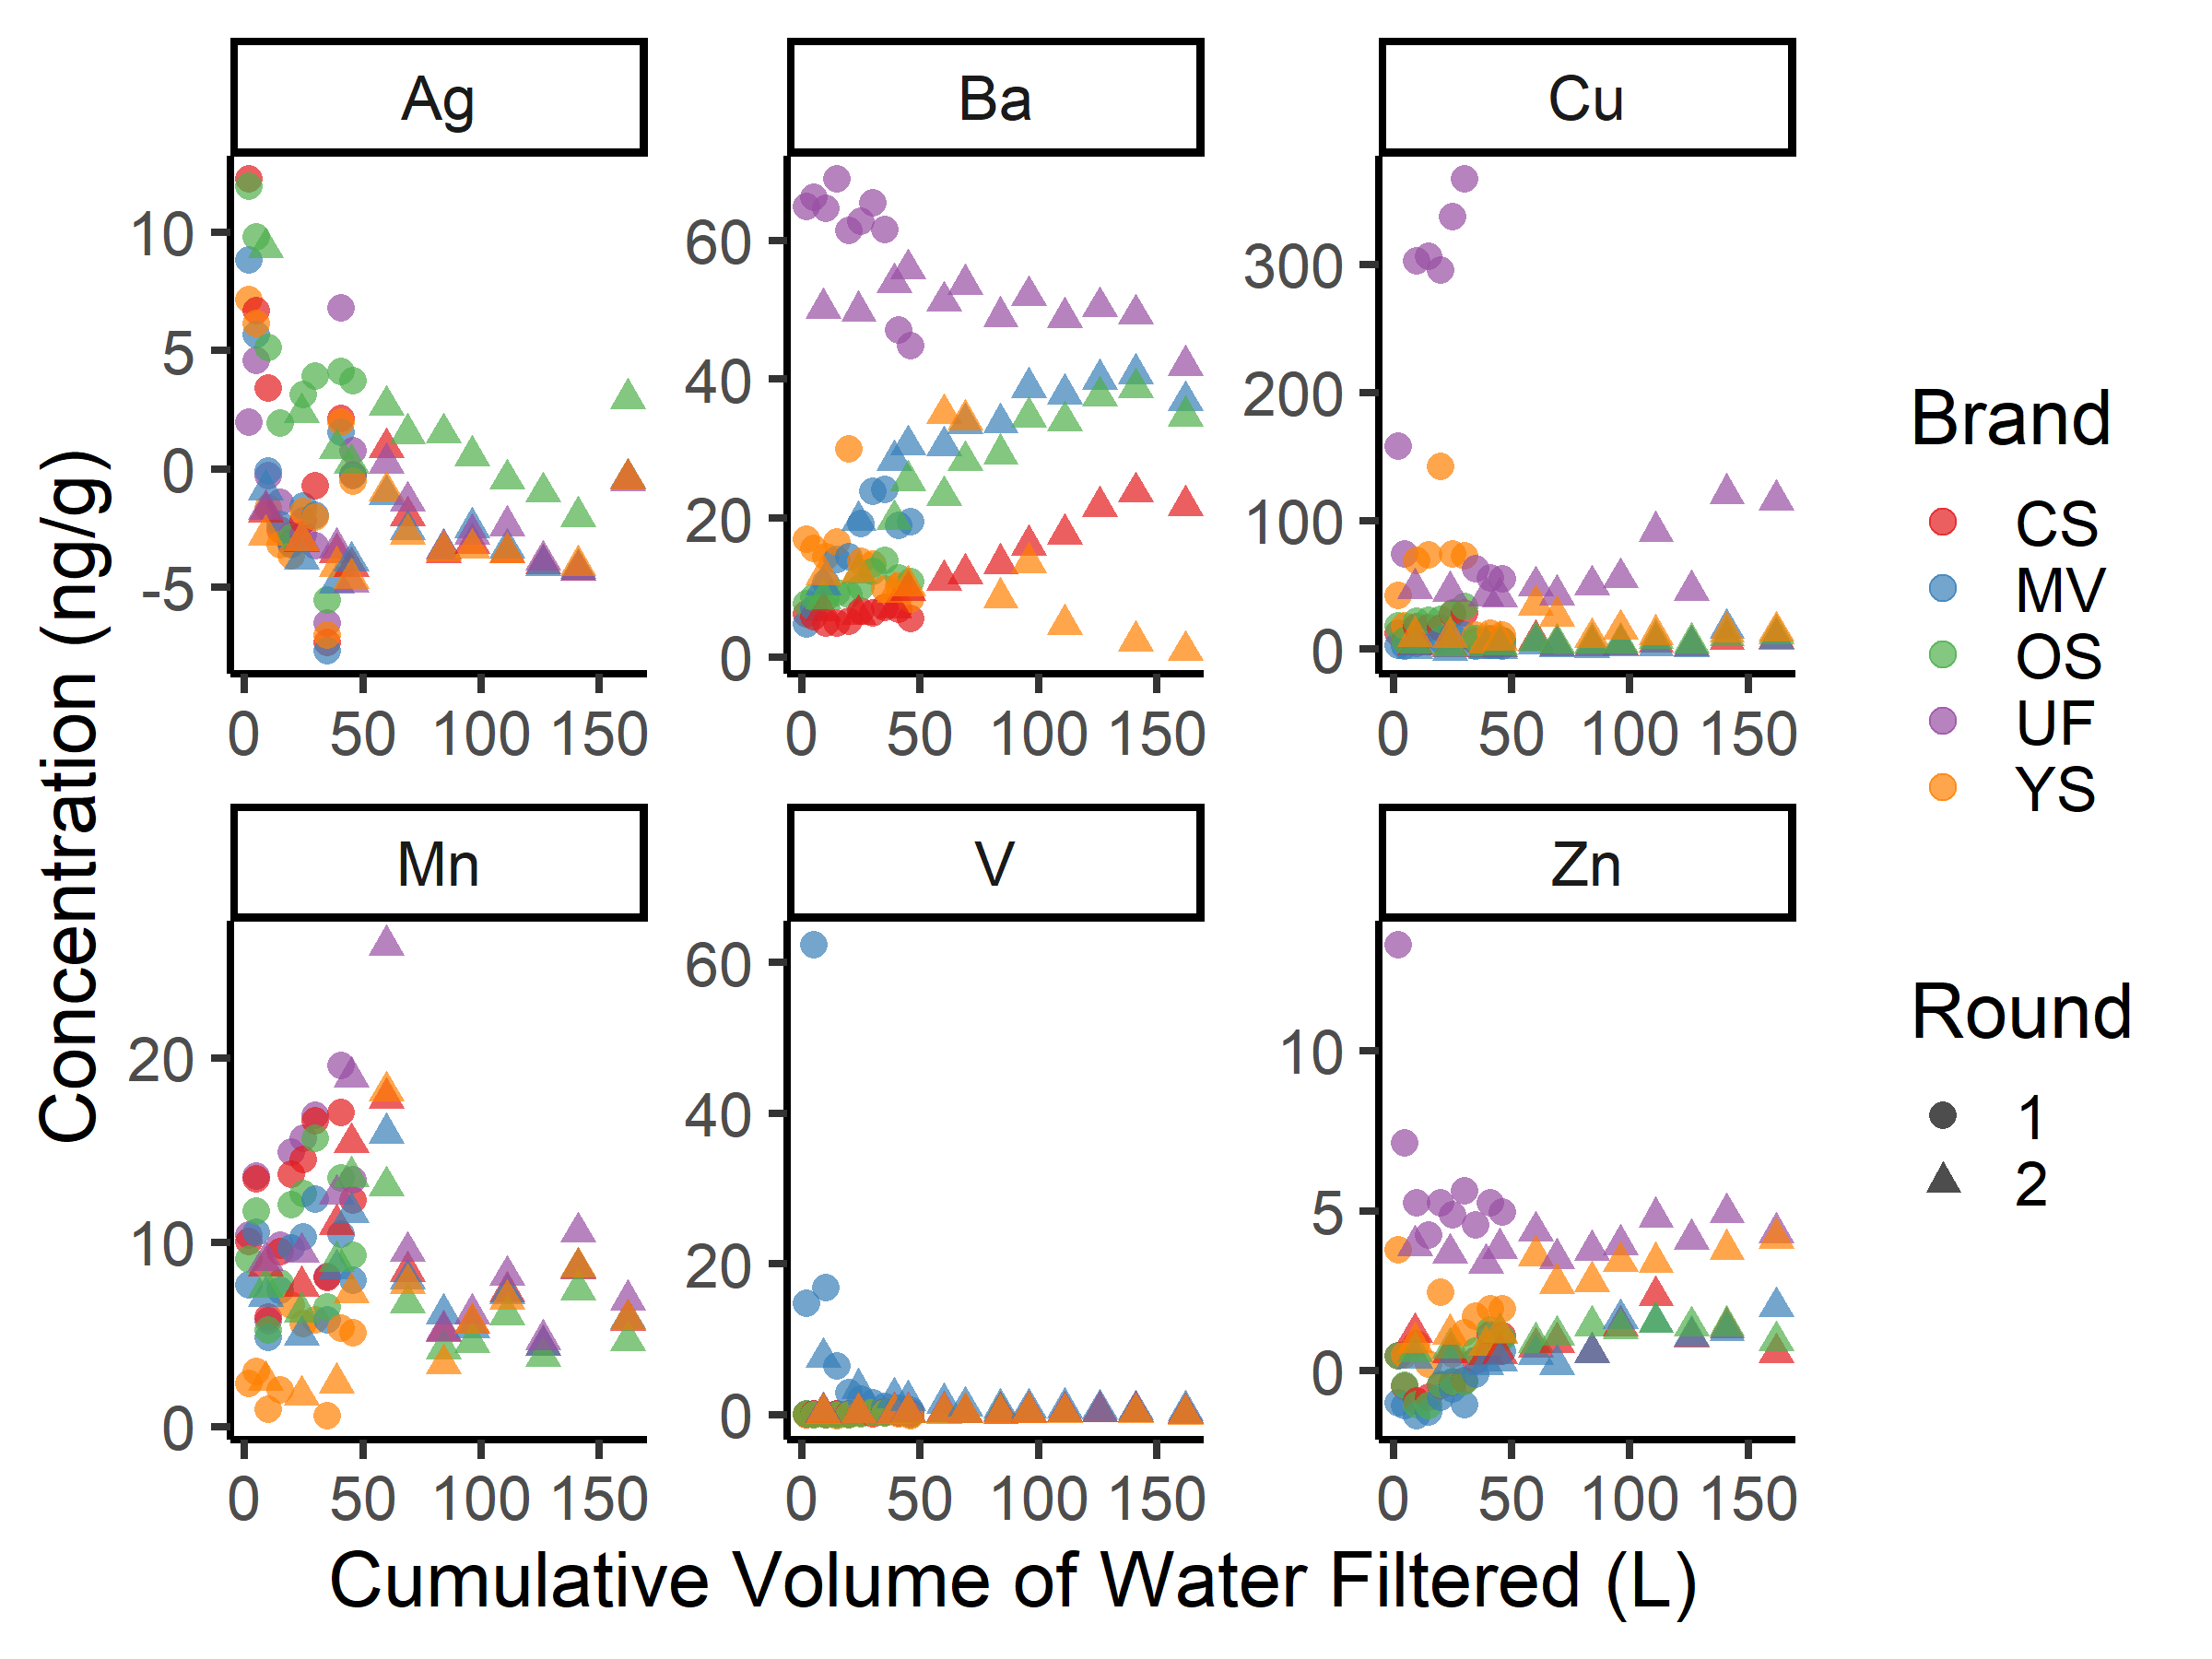
The concentrations of six minor elements in the filtered water are presented in Figure 3. The concentrations of Al, As, Be, Cd, Co, Cr, Fe, Ni, Pb, Sb, Se, and Tl are not shown because they did not occur in the unfiltered water at concentrations above the element detection limit. The Ag concentrations were all below the limit of quantitation with the exception of the first sample in round 1. The major visible trend for Ag in Figure 3 was the consistently larger concentration of Ag in water from the OS filter compared to the unfiltered water or any other filter.
All of the filters demonstrated some capacity to remove Ba, Cu, Mn, V, and Zn from drinking water. The CS, MV, and OS filters initially reduced Ba to effectively zero, although they gradually lost the capacity to remove Ba with continued use. The MV filter released up to 60 ng/g of V into the water over the initial 15 L of the experiment. The V release occurs with the release of K from this filter, although there is not a clear cause for the coincidence.
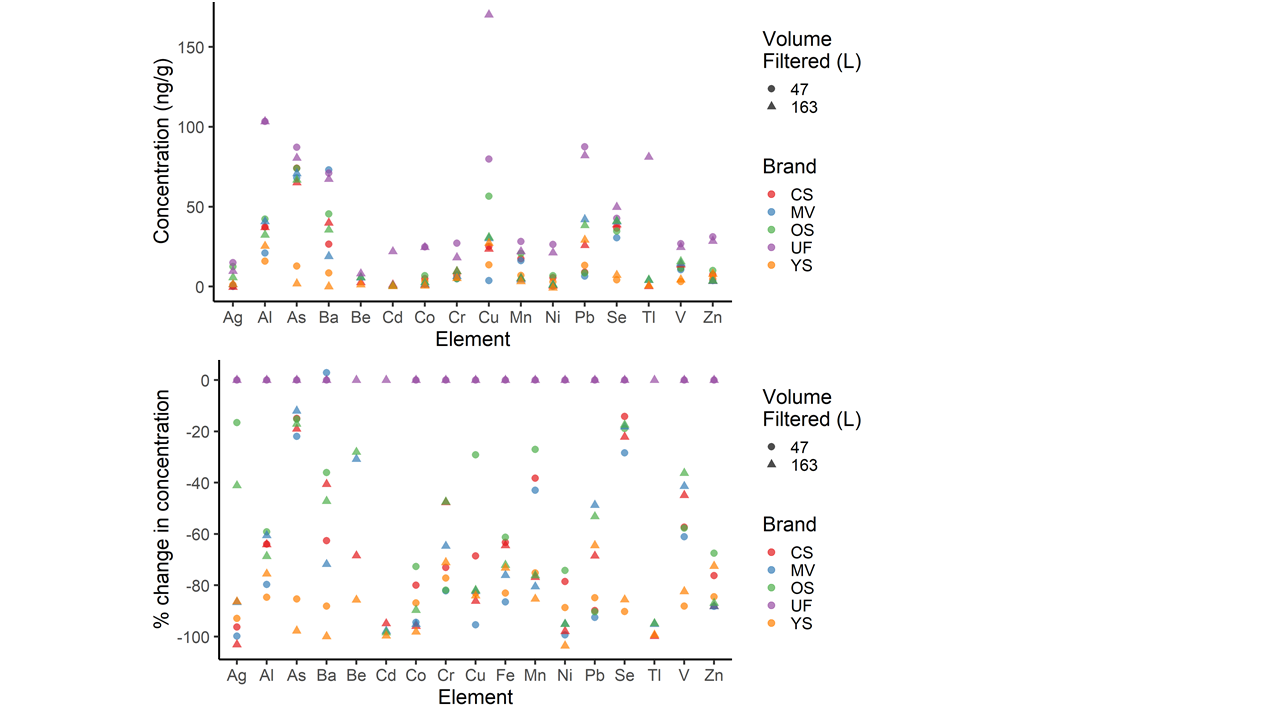
The results of the spiked tap water samples are shown in Figure 4. The spiked water sample was passed through the filters after they had filtered 47 and 163 L of water, respectively for rounds 1 and 2. Therefore, the spike experiments represents the performance in the middle of the filter’s capacity and at the end of its capacity. The YS filter decreased the concentration of all of the spiked elements shown in Figure 4 by between 65 and 100 %. The other filters (CS, OS, and MV) demonstrated more selective removal of the spiked species, particularly As, Mn and Se which were inefficiently removed by these three filters. The result for As agrees with prior studies of the CS, OS, and YS filters and the result for Mn was similar to that of other pour-through filters.19,31 The removal of Al, Ba, Cu, Fe, and V show varying effectiveness among the filter brands. All filter brands were very effective at removing Pb from the spiked water at 47 L (85 to 92 %), but were less effective after having filtered 163 L (49 to 69 %). The spiked water was prepared with soluble Pb and the results are similar to prior studies of soluble Pb removal by point-of-use filters.24,25
The second spike experiment (163 L final volume) included Be, Cd, and Tl as spike elements. All of the filters removed Cd to 1.1 ng/g (95 % removal) and Tl to 4.1 ng/g (95 % removal) or better. Beryllium removal was more varied among the filters and ranged 28 to 86 % with the YS filter removing the greatest amount. The CS and YS filters reduced the Be spike from 8 ng/g to below the EPA MCL of 4 ng/g.
The composition of several bottled waters was evaluated to examine how the filtered water compares to bottled water available to the SIUE campus population. The bulk water characteristics are shown in Figure 5. The filtered water overall has a greater conductivity than the bottle water due to the large Na concentration of the source water. The bottled waters can be divided into two groups: purified water (AQ, CR, LW, SW) and spring water (AP, EV, and IM) with the filtered water more closely resembling the spring water in Figure 5.
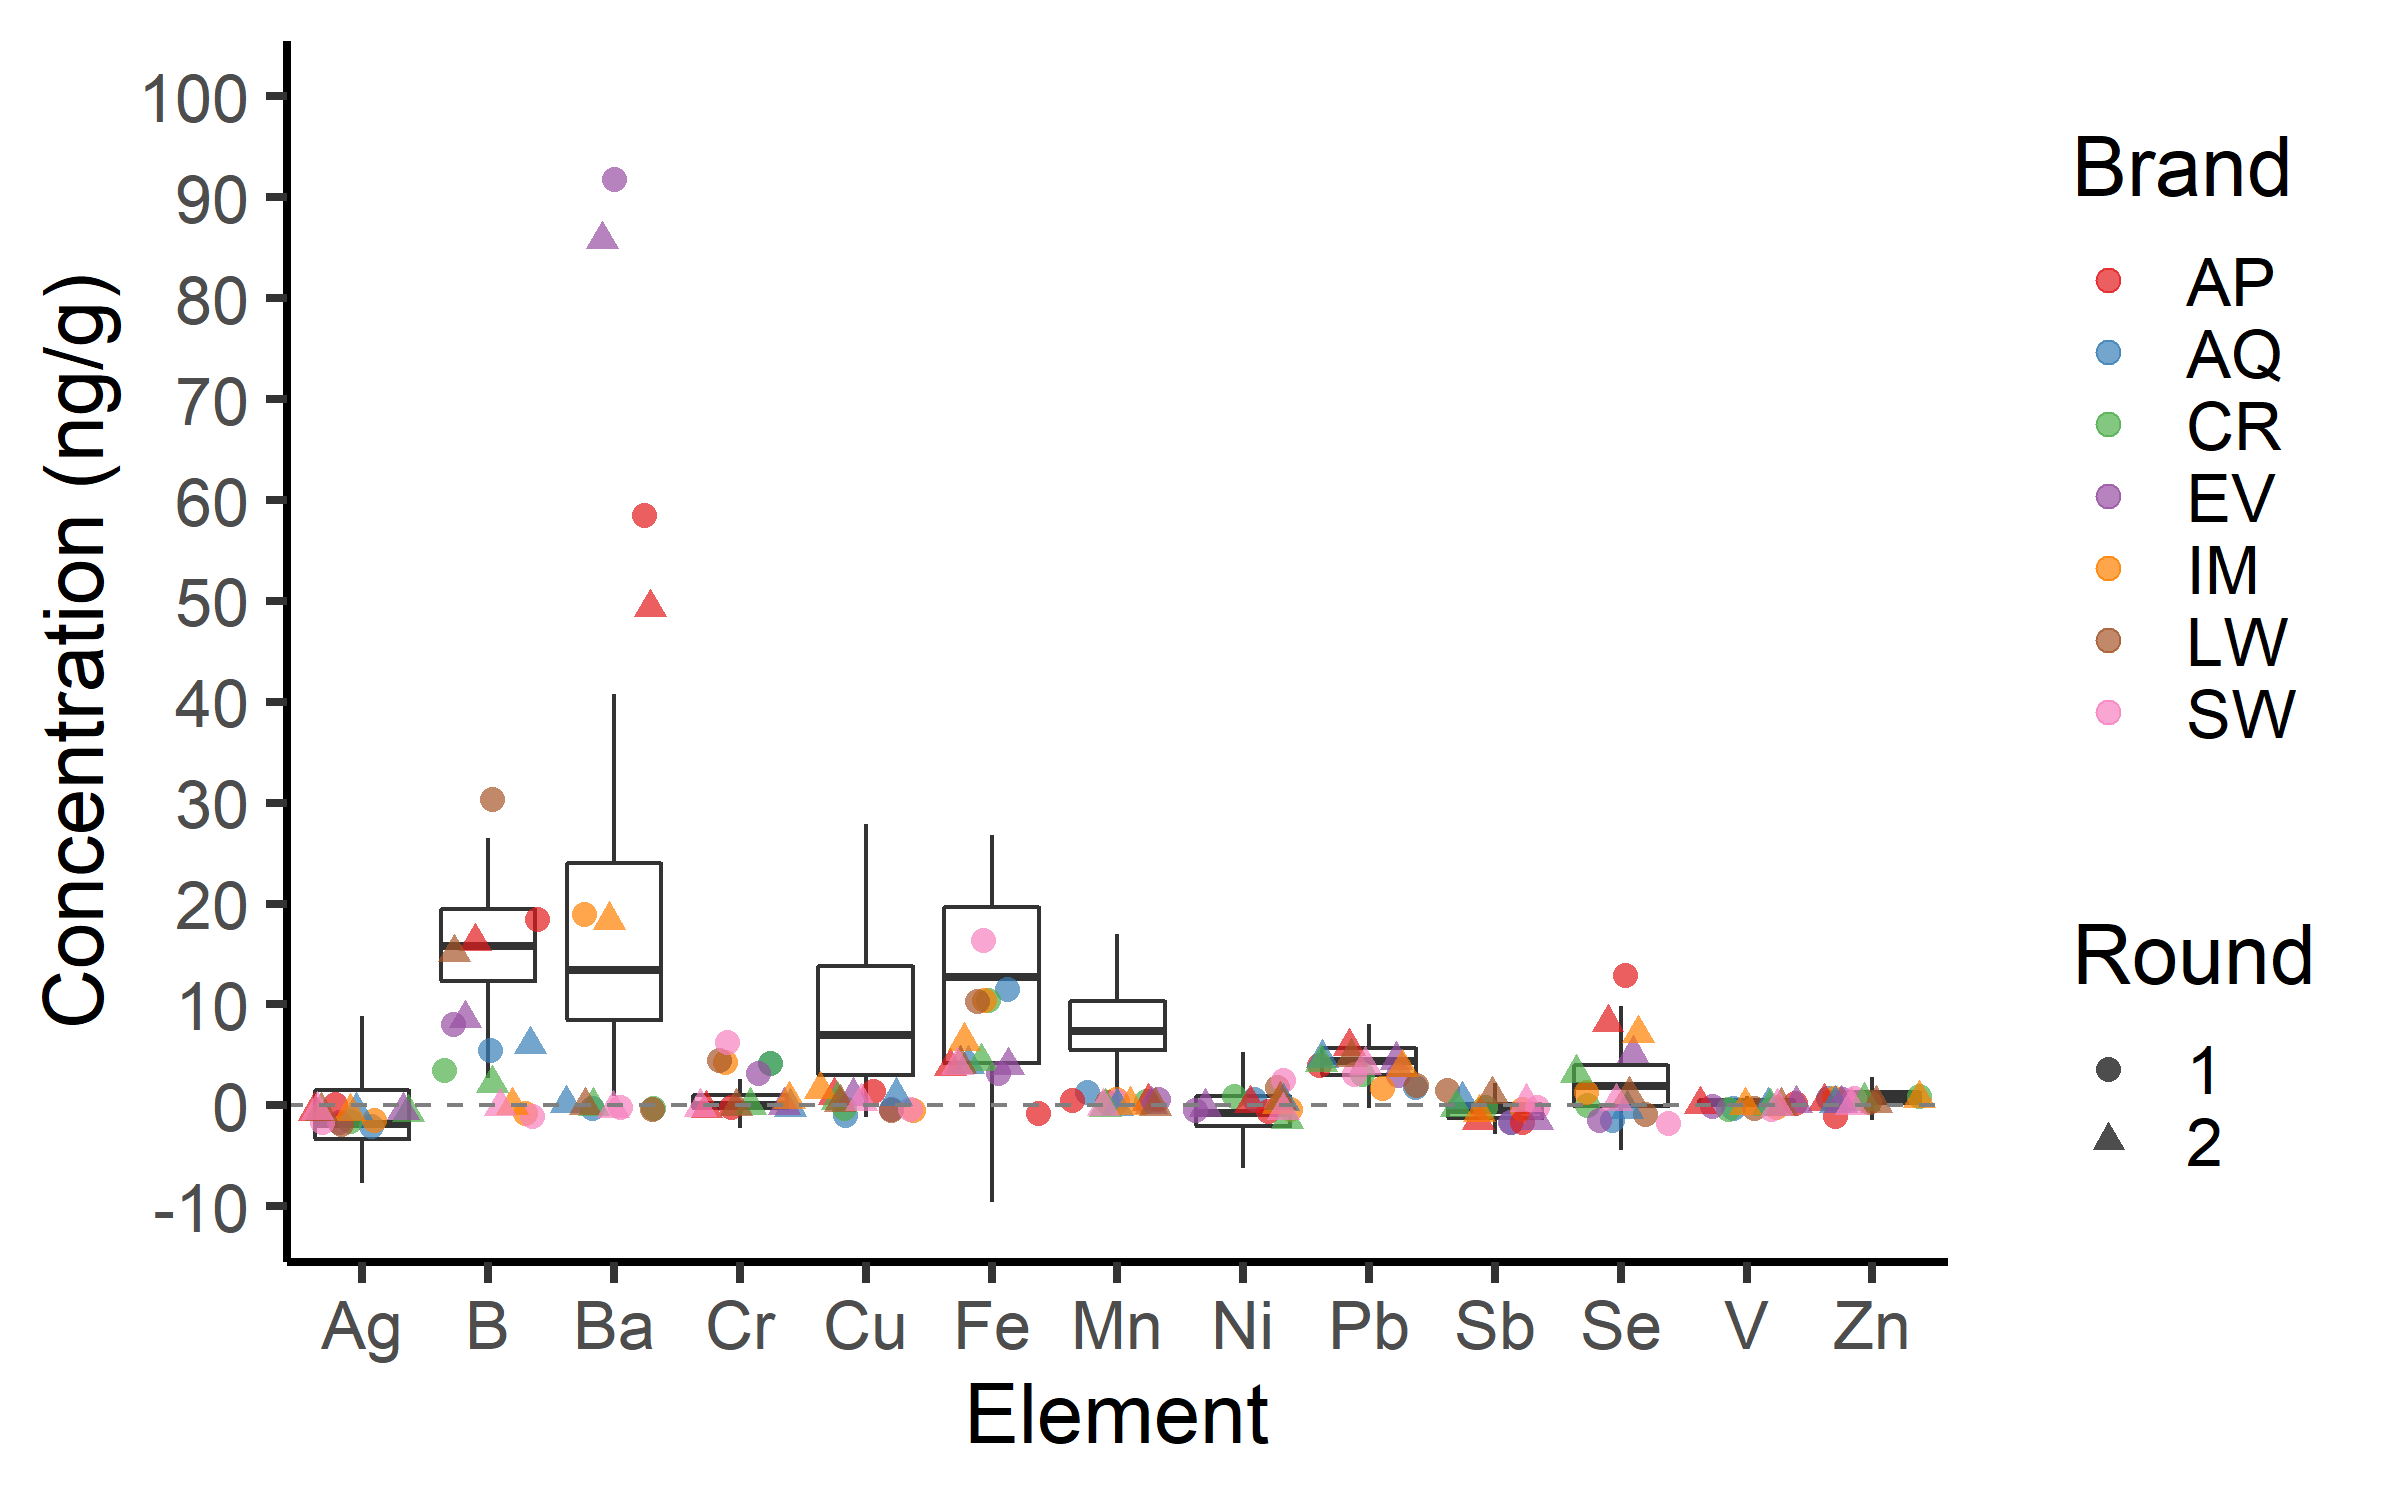
The results of the elemental analysis of the bottled waters, shown in Figure 6, demonstrated that bottled water contains similarly small amounts of elements of concern versus the filtered tap water. Several elements (Ag, As, Mo, Ni, Sb) did not occur significantly in any sample. The Pb concentrations of all of the bottle waters were at or below the detection limit (4 ng/g). The Cu and Mn concentrations of all of the bottled waters were much smaller than the filtered waters. The spring waters (AP, EV, and IM) had large Ba concentrations due to the geology of their sources. Selenium was detected in the AP bottle water at concentrations greater than that of the filtered water.
The concentrations of major elements in the bottled waters and filtered waters are shown in Figure 7. The purified waters (AQ, CR, LW, and SW) contained small concentrations of Ca, K, Mg, Na, and Si with the exception of CR which was a purified water containing potassium bicarbonate. The spring waters (AP, EV, and IM) contained significant amounts of Ca and Mg. All of the bottled waters contained less Na and Si than the filtered waters due to the very large concentration of these two elements in the source water. Much of the conductivity differences between the bottled and filtered waters shown in Figure 5 can be rationalized by the concentrations shown in Figure 7.
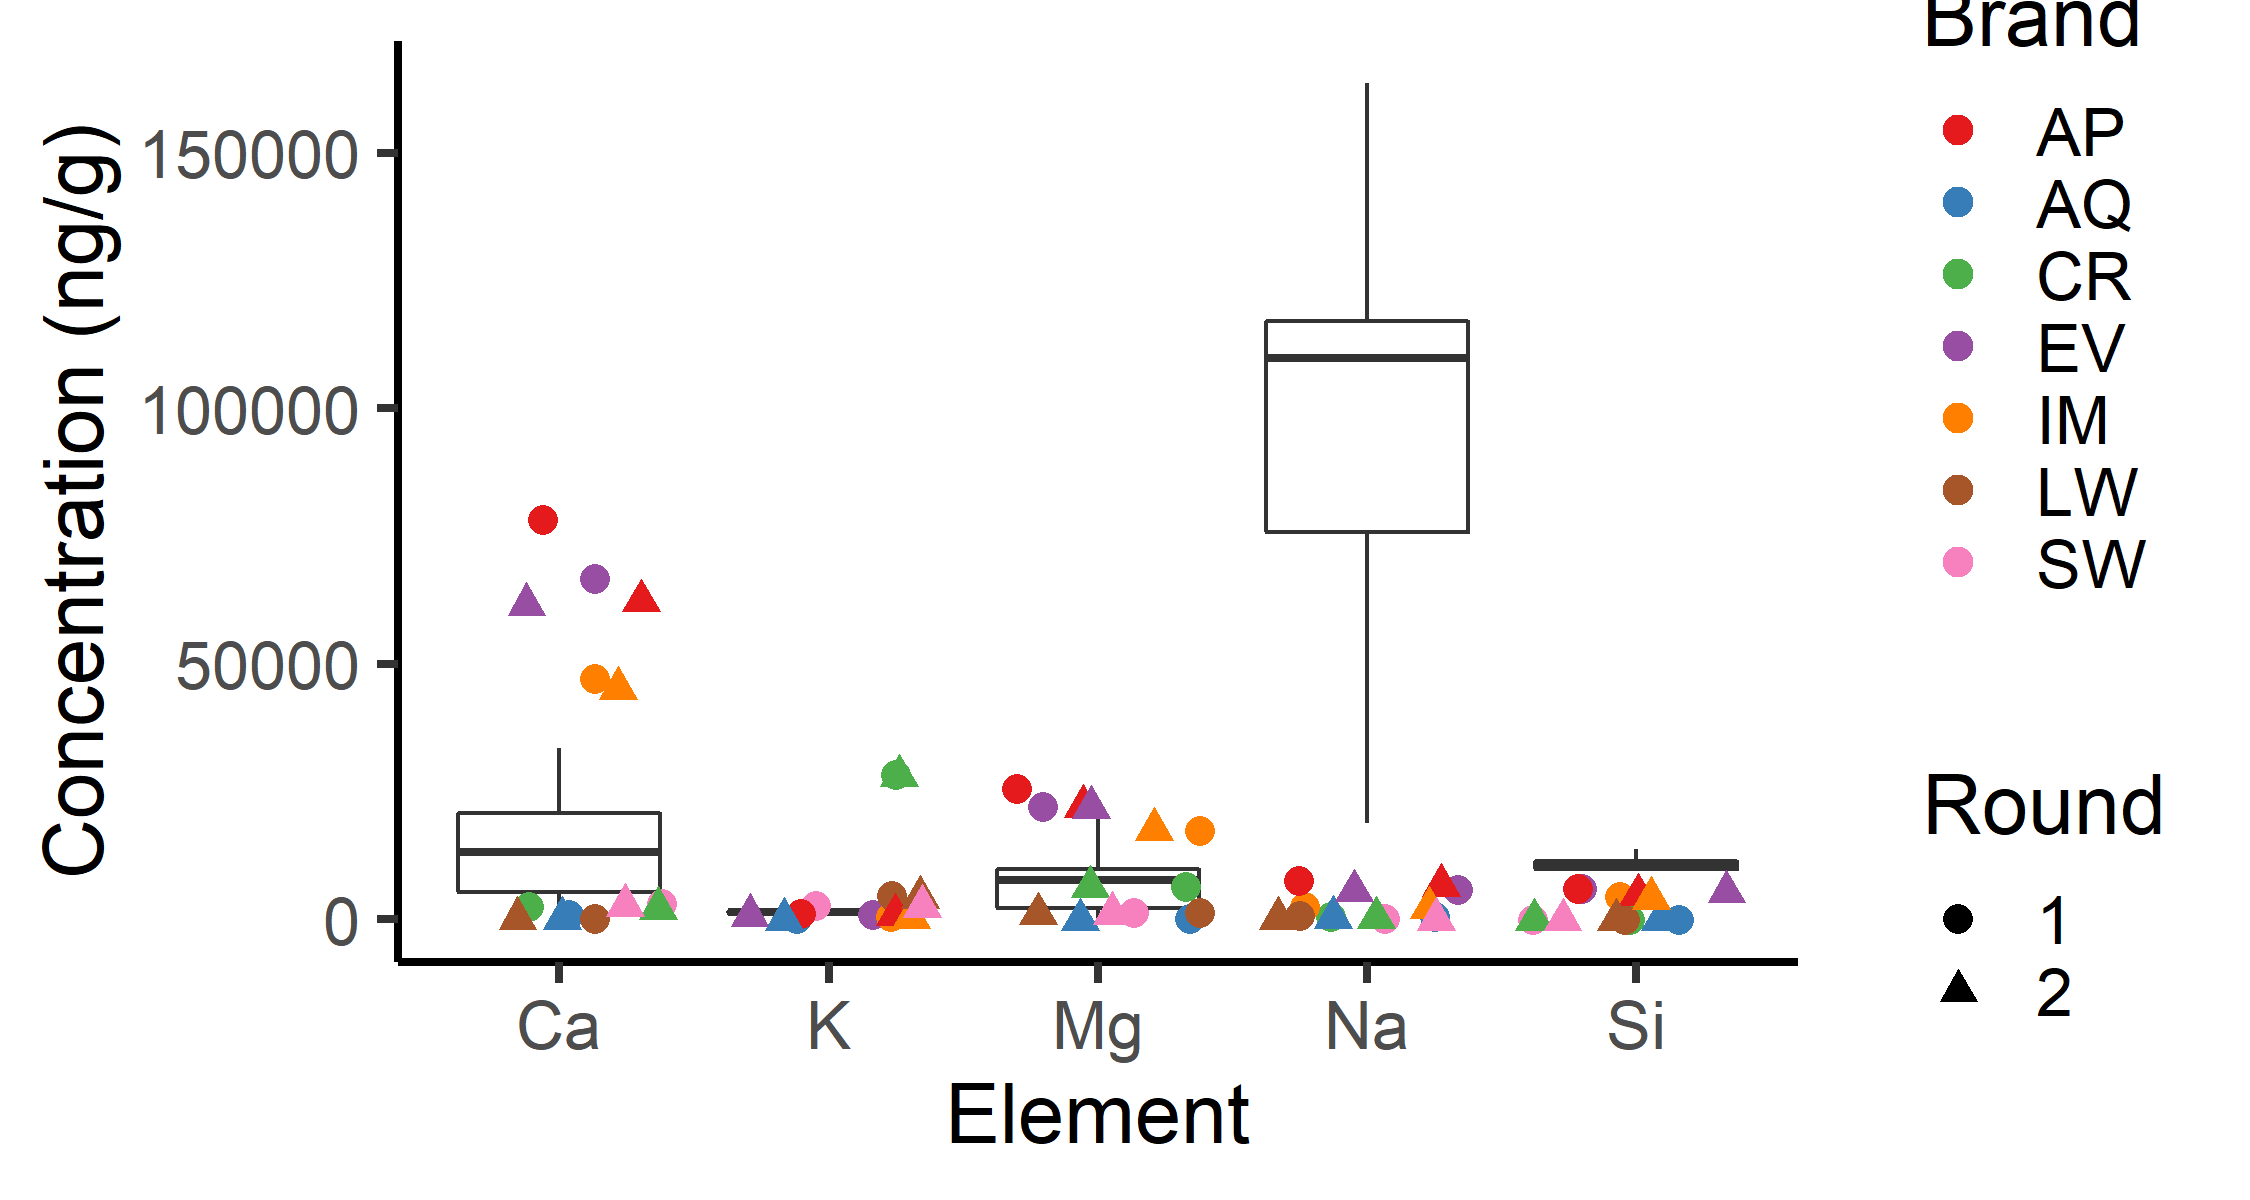
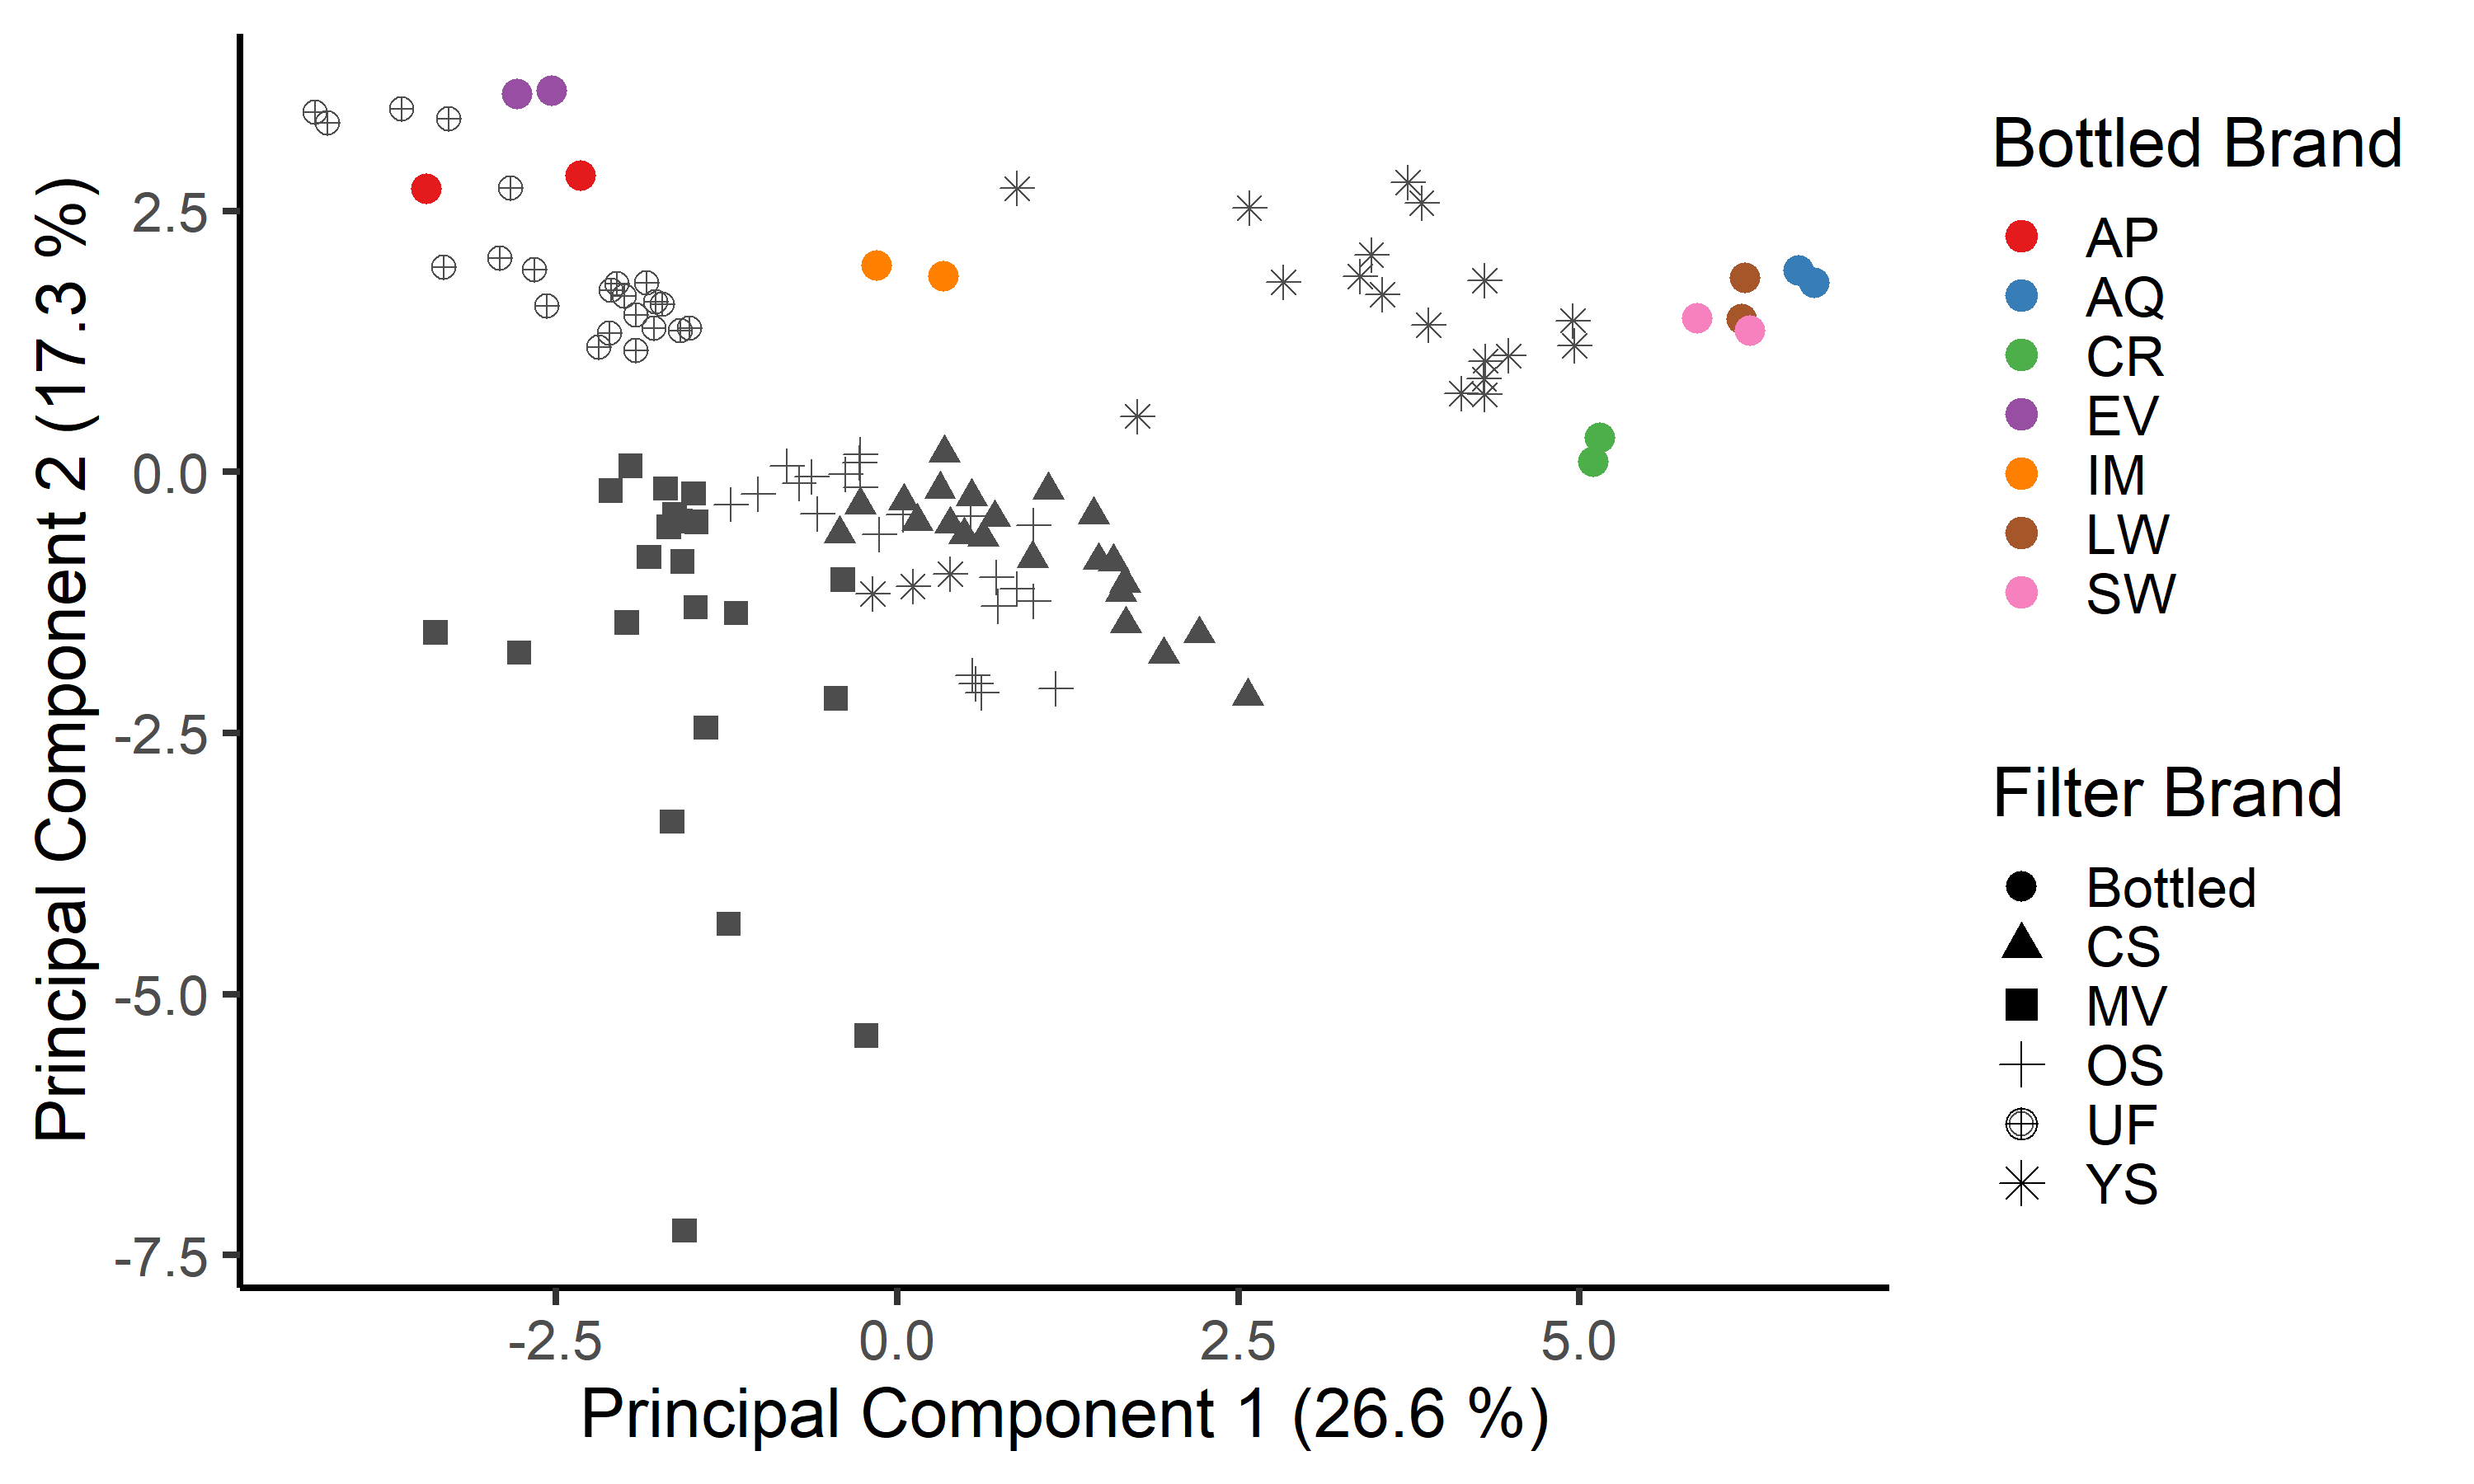
Figure 8 presents a principal component analysis of the filtered water data as an aggregate assessment of the waters. The PCA model was built from the tap water data of all of the elements with concentrations above the detection limit and the bulk water properties; a total of 18 variables. Figure 8 shows principal components 1 and 2 which account for 26.6 % and 17.3 % of the variance in the 18 variables. The bottled water data was projected onto the PCA coordinate system to identify the overall similarity between bottled and tap waters. The PCA result shows that the YS filtered water most resembles the purified waters (AQ, CR, LW, and SW) due to the ability of the YS filter to remove most elements efficiently and reduce the conductivity when the filter is relatively new (less than 50 L filtered).
Conclusions
All of the filters were effective in reducing the inorganic contributions to the negative aesthetic properties of the tap water including Cu and Mn. Iron was not detected above the detection limit in the tap water, but was reduced by 60 to 85 % by the filters in the spiked samples. The Na concentration was reduced only by the YS filter. By contrast, all of the bottled waters contained Cu and Mn at concentrations near the detection limit (0.5 and 0.03 ng/g, respectively), undetectable amounts of Fe, and much smaller Na concentrations than any of the filtered waters (Figure 7).
The PCA summary, Figure 8, suggests that water from the YS filter is most similar to purified water, brands AQ, CR, LW, and SW. The bottled spring waters (AP, EV, and IM) appear close to the unfiltered tap water in Figure 8. However, their properties in terms of aesthetics are significantly different as shown in Figure 6 and Figure 7 in which the bottled water has much smaller Cu, Mn, and Na concentrations. Overall, the YS filter appears to provide water similar to purified water and can offer an alternative to the consumption of purified bottled water. The resource difference of using the YS filter instead of bottled water for a person consuming 4 L per day would be $1460 for bottled water versus $452 for filtered, assuming $1 per L for bottled water and the retail price of 30 YS filters. It is difficult, and beyond the scope of this article, to estimate the energy and plastic waste difference between bottled and filtered water; however, the energy input into transportation alone for bottled water accounts for as much as half of its total energy input and suggests a significant net resource savings for filtered water.14
The manufacturer suggested operational volumes for the filters are CS = 151 L, MV = 242 L, OS = 151 L, and YS = 57 L under the conditions of this study. The ion exchange components of the CS, MV, and OS filters undergo changes in their behavior (Figure 2) at about 50 L or 30%, 21 %, and 30 % of filter capacity, respectively. The YS filter is at its capacity at 50 L. The cessation of release of potassium and sodium from the CS, MV, and OS filters does not indicate the saturation of the ion exchange filter as shown by the continued ability to remove other dissolved elements from the spiked water samples (Figure 4). Rather, with continued use the filters gradually lose the ability to remove elements in the water, exemplified by the Ba and Zn results in Figure 3.
The tap water used in this study has a large amount of Na (113 µg/g) and Si (11 µg/g) which resulted in a foreshortened functional capacity for the YS filter. The YS filter shows a loss of B and Si removal starting at 50 L although it retains the ability to remove other elements at larger filtered volumes. The manufacturer indicates the capacity of the YS filter to be exhausted when the total dissolved solids of the filtered water increases significantly. This metric was surpassed at about 50 L as indicated by the increased conductivity (Figure 1) at that volume. As a result, the first spike experiment at 47 L was approximately at the end of the functional capacity and the second spike experiment was at roughly three times the capacity. When used beyond its recommended capacity, the YS filter continues to remove elements of concern to both health and aesthetics (Figure 4) with the exception of Cu and Pb for which the YS filter was not able to remove Pb to below the 15 ng/g EPA action limit when challenged by an 85 ng/g spike.
As the filters approach their maximum capacity (CS, MV, OS) or exceed their capacity (YS), their ability to remove elements that present health or aesthetic concern tended to decrease as shown in Figure 4. Arsenic, beryllium, selenium, and vanadium were only removed efficiently by the YS filter in both of the spike experiments. All filters had less ability to remove Al, Cr, and Pb at 163 L versus 47 L of filtered water. None of the filters were able to reduce the 85 ng/g Pb spike to below 15 ng/g after filtering 163 L of tap water. The Pb removal results for the first spike (47 L) agrees with other studies22,24,25. However, the second spike (163 L) shows poorer Pb removal perhaps due differences in the source water. Water in this study had a mean alkalinity of 227 mg/L as CaCO3 compared to values less than 110 mg/L in Purchase, et al. and Mulhern et al. The large Na and Si concentrations of the unfiltered water presented a challenge to the ion exchange components of the filters. The results in this study are broadly relevant to public water systems that use sodium silicate as a corrosion inhibition system and consequently have large Na and Si concentrations.32,33
Acknowledgements
The SIUE Undergraduate Research and Creative Activities program is thanked for their support of Molly Walker.
Jack Quade of the Perkin Elmer Corp. is thanked for his generous assistance with the ICP-OES system.
References
Footnotes
Filter names are obscured for legal reasons. The author can be contacted for more information.↩︎