Structural and Control Patterns of Depository Institutions
in Kentucky
Bin Zhou
Department of Geography
Southern Illinois University Edwardsville
Edwardsville, IL 62026
1. INTRODUCTION
Financial crisis in Asia in the late 1990s has highlighted the importance
of money in economic growth and development. The essential issue is the
amount of money available to an economy. When everything else is the same,
an economy with an ample supply of money would experience more rapid growth
than would otherwise. The amount of money available to a national economy
or the supply of money is determined by the operation of the financial
market as well as the monetary policy. Most analysts concentrate on monetary
policy as a factor in determining the money supply at the national level.
This paper deals with factors other than monetary policy, which may affect
money supply at the regional level of a domestic economy. There has been
a tradition in regional economics that examines determinants of the regional
supply of money. (7) Geographers have discussed the command and control
structure of banking. (5) In addition, both economists and geographers
have discussed issues related to banking market structure. (6, 9) This
research is set on a conceptual footing that market structure, and control
structure of the financial industry affects money supply at the regional
level. Consequently, market structure and control structure of the financial
industry act as a factor that affects economic growth and development.
Such a conceptual base requires an investigation that involve several related
issues. First, what is the market structure and command and control structure
in a regional financial market? Second, how does the market structure and
control structure of a regional financial industry affect regional money
supply? Third, how does the market structure and control structure of a
regional financial industry affect economic growth and development? As
an initial step toward study in this direction, this paper deals specifically
with the first issue, the market structure and the structure of the command
and control of a regional financial market. The study area is Kentucky.
The financial industry in this paper is defined as all depository institutions,
including commercial banks, thrifts (savings banks and savings and loan
associations) and credit unions. The reason that Kentucky is chosen as
study area is that the state contains economically drastically different
counties, such as Appalachian, rural non-Appalachian, and metropolitan
counties. This provides some "typical" examples for comparison. In addition,
the reason that the depository institutions are chosen as the focus of
study is due to the ease in obtaining information on the locations of operating
offices.
2. Money, Regional Financial Market, and Economic Growth
Mainstream economic thought in the late 20th century has seemed to arrive
at a worldwide consensus concerning the relationship between economic growth
and development on the one hand, and money on the other. Increasing the
amount of money to promote growth or tightening money supply to put a brake
on inflation has become part of regular macroeconomics policies adopted
by governments in the West and other places alike. Money mobilizes real
resources that are in idle and channels resources into further services
by functioning as rewards to resource owners. Money acts a similar mechanism
at the regional level of a domestic economy. Regional economic stagnation
or distress reflects a state of aggregate supply and demand that works
against a region. On the supply side, a region may lack the resources necessary
for a meaningful growth such as needed natural resources, physical capital
that is embodied in various economic sectors, and a labor supply of sufficient
quantity and quality. Problems within Appalachia have long been attributed
to traditional economic sectors such as agriculture, coal mining, traditional
manufacturing, etc. that have been in a long term decline since the early
20th century, to a lack of sufficient human resources such as education
and entrepreneurship, and as well as to a lack of easy access. (8) Traditional
development policies have mainly focused on the improvement of regional
supply conditions, as evidenced by highway construction, community and
education developments, etc. in various Appalachian development programs.
(2, 3)
On the demand side, lack of sufficient demand in a region may be due
to an insufficient amount of money related to low income, lack of viable
investment opportunities, etc. (2, 3) The strategy to promote tourism in
Appalachia can be seen as an effort to market the region as a profitable
investment location for new industries. Little effort has been given to
the discussion of increasing the money supply of Appalachia as a possible
strategy to enhance the aggregate demand. It may be illuminating that the
22 million people in Appalachia in 1997 was comparable to the population
of Malaysia, which achieved startling success in growth and development
prior to the 1997 financial crisis. In terms of physical size, Appalachia's
200,000-square-mile area is slightly larger than Malaysia. The success
of Malaysia in promoting growth is partly attributed to the massive inflow
of foreign capital. It is entirely conceivable that an independent country
of the size of Appalachia could achieve a rate of growth seen in Malaysia
via attracting capital from foreign lands. The reality is that the chronic
decline of Appalachia demonstrates a declining money income, which contributes
to a lack of demand.
It may well be that Appalachia's status as an integral part of the United
States has hurt its chance for growth. This is so because monetary policies
designed to stimulate regional aggregate demand would be ineffective within
a national economy where a single national currency is adopted. Under a
single currency, absence of spatial difference in exchange risk would result
in a redistribution of money from policy-target regions to unintended regions
via correspondent banking and other forms of investment. High unemployment
rates and out-migration have prevailed in many areas of Appalachia since
early this century, reflecting a region with untapped resources. It was
no help that the Federal Reserve gave up the practice whereby different
regional reserve banks set interest rates according to the regional financial
conditions. In reality, regions in slow growth may well need some extra
amount of money to mobilize their resources, and regions with an overheated
economy may well need a brake on their inflation. A uniform interest rate
across the country set by the central bank would provide money with the
same credit terms and may not fit various regional conditions. The result
is to weaken the role of monetary policy as a viable tool in promoting
regional growth.
Since it is unlikely that there would be an Appalachia oriented monetary
policy, the monetary policy as an option in promoting regional growth seems
out of the question. However, there are other factors that also affect
the amount of money potentially available to a region. One of these factors
is the financial market structure. The theory of the regional financial
market (1, 4) suggests that there exists a spectrum of regional segmentation
of financial markets, ranging from perfect financial capital mobility to
complete segmentation. Financial segmentation refers to the imperfect mobility
of financial capital between regional and national markets which arises
partly due to a less than competitive institutional structure of the local
banking industry. In a competitive financial market, a shortage of funds
will translate into higher regional interest rates than in the national
market, and thus attract national capital into the region and augment the
credit supply. However, in a less than competitive market fixed-price tends
to prevail via mechanisms such as price-leader. Fixed-price will result
in the allocation of funds via rationing in which the "implicit contract"
is struck between the lender and borrower to minimize the risk. The economically
stressed regions or a local market unfamiliar to investors at the national
financial market may be required to pay a location-related premium on top
of the regular interest charge to correct the investment risk associated
with the region. The fixed-price and implicit contract in less than competitive
markets may force down such location-related premiums, and thus discourage
financial flow from national to regional markets. The result is inadequate
supply of credit in a local area.
Corporate control structure of the financial industry may also affect
the regional money supply. (10) Entries by outsiders may change the market
structure of the financial industry in a region. In addition, the presence
of outsiders in a local market may exert pressures on the local institutions
to increase transparency in business dealings and become more competitive.
In discussing Asian financial problems, analysts have demonstrated a perplexing
contradiction concerning the merit of outside ownership in the financial
industry. On the one hand, many blamed foreign ownership as a culprit in
causing the sudden withdrawal of money from emerging economies that eventually
led to the financial crisis. On the other hand, prescribing remedies to
the problems in the financial sector of emerging economies, many analysts
have hailed foreign ownership in the banking sector as a way to increase
the competitiveness of a country's financial industry. Although these conflicting
arguments appeared since the Asian financial crisis, they are simply variants
of the same conflicting statements that have made their appearance in the
U.S. banking industry. There have been constant battles in U.S. banking
history between banks with various locational affiliations such as community
banks, regional banks, and banks with national dominance. The essence of
the battle is the claim to bank resources lying in a community. Before
banking deregulation, there had been a long tradition that saw bank ownership
in a local area by outside banks as a "bad" thing. The reason was that
outsiders would necessarily take local deposits and invest somewhere else,
which would drain resources out of a community and thus hurt its growth.
The agitation against branch banking and interstate banking, and strong
sentiment against large city banks were partly based on such an argument.
The recent two decades have seen a reversal of the tide in which banking
consolidation has swept the United States in the name of increasing local
market competitiveness as well as achieving economies of scale and scope.
However, old arguments die hard. Today, there are still concerns that non-local
banks may not be willing to lend to local establishments, especially small
businesses. The Community Reinvestment Act (1977 and revised in 1995) is
partly intended to make outside banks accountable for providing credit
to small businesses in the communities in which they operate. Clearly,
outsider ownership could be an evil when it is seen as the source of resource
drainage, or virtue when seen as a way to improve the competitiveness of
a local financial market. Since the logic could go either way, the impacts
of outside ownership largely become a matter of empirical evidence.
3. Study Area
In this study, all Kentucky counties are grouped into three categories.
The first is Appalachian, defined as rural counties that are designated
as Appalachian by the Appalachian Regional Commission (ARC). Metropolitan
areas that are designated as Appalachian by the ARC are not included in
this group. In 1997, there were 44 counties in this category. The second
group are rural non-Appalachian counties. There were 54 such counties in
1997. The third group consists of 22 metropolitan counties, including 17
non-Appalachian metropolitan counties, and 5 metropolitan counties designated
as Appalachian by ARC. In 1997, per capita incomes in all but two rural
Appalachian Kentucky counties were less than 70% of the U.S. average. In
comparison, only 2/5 of the non-Appalachian rural counties, and 4 out of
22 metropolitan counties, had a per capita income less than 70% of the
U.S. average. In 1996, the percent of people in poverty in Kentucky as
a whole was 17.9%. All rural Appalachian counties except one had a poverty
population higher than the state average, more than half of which were
higher than the state average plus one standard deviation. In comparison,
only a third of the rural non-Appalachian counties, and 2 out of 22 metropolitan
counties had a poverty population ratio higher than the state average.
Outside rural Appalachia, only one county had a poverty population ratio
higher than the state average plus one standard deviation. In 1996, the
unemployment rate in Kentucky Appalachia stood at 8.1%, while the corresponding
number for the U.S. was 5.4%, and for the Appalachia region as a whole
5.7%. In the same year, 15 rural non-metropolitan Kentucky Appalachian
counties had a 2-digit unemployment rate. All but 7 rural Kentucky Appalachian
counties are designated distressed counties by the ARC. In these distressed
counties, per capita income is no more than two-thirds of the national
average and poverty and unemployment rates are at least 150 percent of
the national rates. Things are not changing for the better for the region
while the American economic boom continues. In 1997, the mean unemployment
rate for Appalachian counties was 8.7%, in comparison with 6.1% and 4.7%
for rural non-Appalachian and metropolitan counties respectively. Apparently,
during the current national economic growth cycle, the longest during the
post war era, when many other regions in the nation face an increasing
demand for labor, Kentucky Appalachia as a whole still suffers from a slack
demand.
4. market Structure of Kentucky Depository Institutions
As of June 30, 1997, there were 459 depository institutions operating
in Kentucky. These firms operated 1667 offices and owned $48 billion in
deposits. A breakdown of these firms along the line of the type of institutions
and their distributions in the three regions defined above are presented
in Table 1. For the state as a whole, commercial banks are a dominant group
of depository institutions. The degree of dominance by commercial banks
appears more prominent when one examines the percent of number of institutions,
percent of number of offices, and the percent of deposits in sequence.
In comparison, thrifts and credit unions hold a significantly smaller share
of the market than commercial banks, and their share declines in a sequence
with the percent of number of institutions, percent of number of offices,
and the percent of deposits.
The patterns illustrated above generally hold for the three groups of
counties, but with important variations. Of the three groups of counties,
Appalachia demonstrates the highest degree of dominance by commercial banks
measured in all three percentages. In comparison, credit unions had an
extremely weak presence in Appalachia, especially as measured by the percent
of the amount of deposits. Metropolitan counties, on the other hand, has
the lowest representation by commercial banks of the three regions, measured
in all three percentages. In fact, their percentage in the number of commercial
banks is actually lower than that of credit unions. Rural non-Appalachian
counties as a whole attracted the largest number of institutions, mainly
commercial banks. Its share for different types of depository institutions
is similar to the state average, especially in terms of the percent of
deposits. A location quotient is constructed for the three groups of counties
via dividing the percent of deposits of a region by the state average,
Appalachia had a value of 1.05 for commercial banks, but a value less than
0.1 for credit unions. Metropolitan counties had a location quotient 1.2
for credit unions, but 0.97 for commercial banks. Both groups had a location
quotient 1.1 for thrifts. Rural non-Appalachia had a location quotient
close to 1 for all types of institutions.
Table 1
Kentucky Depository INSTITUTIONS
(percentage distribution in parentheses)
| Region |
Type of institutions |
# of operating institutions |
# of operating
offices |
Total deposits
($million) |
| All |
Total |
459 (100) |
1649 (100) |
48068 (100) |
| Kentucky |
Bank |
278 (61) |
1356 (82) |
41113 (86) |
|
Thrift |
46* (10) |
158 (10) |
4562 (9) |
|
Credit Union |
135 (29) |
135** (8) |
2393*** (5) |
| Rural |
Total |
99 (100) |
323 (100) |
7997 (100) |
| Appalachian |
Bank |
78 (79) |
282 (87) |
7180 (90) |
| Kentucky |
Thrift |
15 (15) |
35 (11) |
795 (10) |
|
Credit Union |
6 (6) |
6 (2) |
22 (****) |
| Rural Non- |
Total |
251(100) |
536 (100) |
13775 (100) |
| Appalachian |
Bank |
140 (73) |
454 (84) |
11868 (86) |
| Kentucky |
Thrift |
16 (8) |
46 (9) |
1208 (9) |
|
Credit Union |
36 (19) |
36 (7) |
699 (5) |
| Metropolitan |
Total |
195 (100) |
790 (100) |
26296 (100) |
| Kentucky |
Banks |
80 (41) |
620 (78) |
22064 (84) |
|
Thrifts |
22 (17) |
77 (10) |
2559 (10) |
|
Credit Unions |
93 (47) |
93 (12) |
1673 (6) |
* including savings banks and savings and loan associations
** each credit union is assumed to be operating in one office
*** includes deposits and shares in credit unions
**** less than 1%
Sources: National Information Center, Federal Reserve Board;
Credit
Union Data, National Credit Union Administration; Summary of Deposits,
FDIC. All data are for 1997.
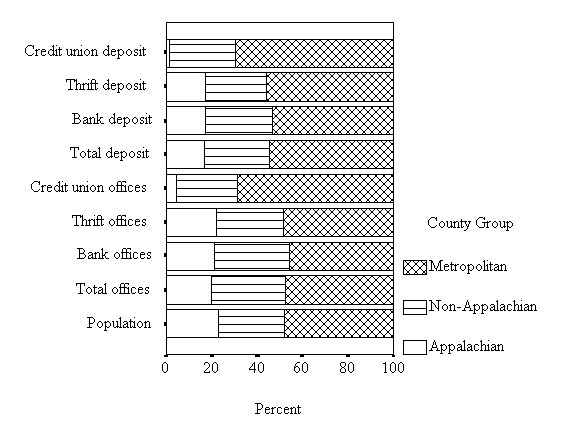
In 1997, Appalachia, rural non-Appalachia, and metropolitan counties
had 22.7%, 29%, and 48.3% of the Kentucky population, respectively. Using
the population share as a benchmark, the banking resource distribution
among the three groups of counties demonstrate uneven patterns. Appalachia
generally had a smaller share of banking resources than their population
share would indicate. However, the unevenness in the number of offices
is lower than that in the amount of deposits, as illustrated in Figure
1. This pattern exists for all three types of institutions. This indicates
that disadvantages in the Appalachian financial market lie more with insufficient
funds than with inconvenient banking locations.
Metropolitan counties contained a share of deposits larger than their
population share would indicate. However, the share of the number of offices
for metropolitan counties was similar to their population share, though
considerable variations exist among different types of offices. For thrifts,
there was a share higher than population share, and for credit unions,
there was a considerably higher share than the population share. These
higher shares, however, were mediated by a share lower than population
share in commercial bank offices. Apparently, the advantage of the financial
market in these counties are mainly reflected in ample funds available
rather than in convenient banking locations.
Rural non-Appalachian counties had a share of deposits similar to their
population share, especially in commercial banks and credit unions. However,
they had a share of offices larger than their population share, especially
for commercial banks. This suggests that rural non-Appalachian counties
as a whole do not face particular disadvantages in terms of the amount
of funds available. In addition, they have an advantage in terms of adequate
locations.
Figure 1
Regional Distribution of Kentucky Depository Institutions
For credit unions, the extreme contrast between Appalachian and metropolitan
counties is seen once again. Credit unions had an extremely strong presence
in metropolitan counties, but were conspicuously lacking in Appalachian
counties. This pattern can largely be explained by the close association
of credit unions with professional occupations and large organizations,
which would presumably be under-represented in Appalachia.
At the county level, the pattern revealed above basically holds. For
example, only 3 Appalachian counties had a deposit share larger than their
population share, and 12 had a share in the number of depository institutional
offices larger than their population shares. The number of rural non-Appalachian
counties with a share larger than their population share in the above two
categories were 18 and 39, respectively. This paper does not investigate
the pattern for the metropolitan counties since most metropolitan counties
in Kentucky form a metropolitan market with out-of-state counties, which
makes the comparison less meaningful.
An important measure of market structure is Hirfendal-Hirschman Index
or HHI, which is the sum of squared percent market share of all depository
institutions in an area. The higher the value of HHI, the more concentrated
the market is. The largest value possible is 10,000, which occurs when
there is only one firm in the market. In 1997, the mean HHI was 5352 for
all Appalachian counties, 3884 for all rural non-Appalachian counties,
and 2786 for all metropolitan counties. Figure 1 reveals a distinct concentration
of counties with a higher HHI in the Appalachian area, and a concentration
of counties with a lower HHI in metropolitan areas. It should be pointed
out that there are rural non-Appalachian counties that are highly concentrated
in terms of banking business. This, however, cannot conceal the fact that
for the region as a whole, Appalachia is more concentrated than the other
two regions. For example, there were 25 Appalachian counties with a HHI
higher than the state mean HHI, while there were only 17 in rural non-Appalachian
counties, and 2 in metropolitan counties. Of the 14 counties with a HHI
higher than 7000, a benchmark used by the Justice Department as high degree
of market concentration, 10 were in Appalachia.
Figure 2
Distribution of HHI in kentucky depository institutions (omitted)
5. Control Pattern of Kentucky Depository Institutions
The 459 depository institutions operating in Kentucky in 1997 belonged
to 385 independent financial corporations. More than half of them, or 53%,
were independently owned institutions (banks, thrifts, and credit unions),
but controlled only 16% of deposits and 17% of offices. The rest 47% were
bank holding companies, which controlled 84% of deposits, and 83% of offices.
There were 22 out-of-state institutions controlling 40% the deposits and
34% of offices. Table 2 reveals how depository institutions headquartered
in one region distribute their business across the three regions in Kentucky.
As can be seen, depository institutions in each of the three groups of
Kentucky counties did most of their business within their own group, reflecting
the high percent of ownership in deposits and offices by a region's institutions
in its own region rather than in the other regions. However, compared with
institutions in Appalachia and rural non-Appalachia, metropolitan institutions
did more business outside metropolitan areas, especially in rural non-Appalachian
counties. Out-of-state institutions also seemed to favor metropolitan areas
as their business locations. Their percent ownership in deposits and offices
is significantly higher in metropolitan counties than that in Appalachian
and rural non-Appalachian counties. Interestingly enough, they allocated
proportions of their business in the three types of Kentucky counties similar
to those by Kentucky metropolitan institutions.
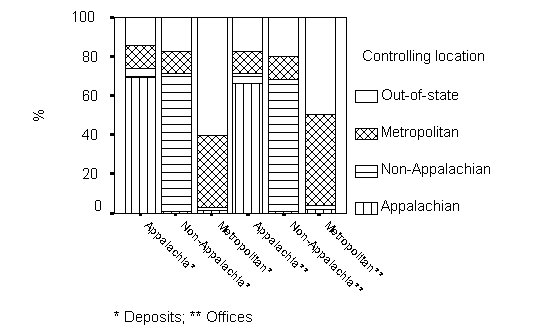
Figure 3 illustrates the controlling locations within the three types
of Kentucky counties. Appalachian counties was least influenced by out-of-state
institutions of all three types of counties. In addition, Appalachia as
a whole was less influenced by metropolitan institutions than rural non-Appalachian
counties. At the county level, a similar pattern can be seen. For example,
the average percent of deposits controlled by out-of-state institutions
was 11% for Appalachian counties, but 13% and 37% for rural non- Appalachian
and metropolitan counties respectively. In addition, the median percent
of deposits controlled by institutions outside a region --including institutions
both outside a region and outside Kentucky-- was 17% for Appalachian counties,
and 17% and 48% for rural non-Appalachian and metropolitan counties respectively.
Table 2
Control pattern of Kentucky Depository Institutions (Percentages in
Parentheses)
 Controlled
in Controlled
in
Controlled by |
State of Kentucky |
Kentucky
Appalachia |
Kentucky
non-Appalachia |
Kentucky
Metropolitan
Areas |
| Kentucky
Appalachia |
6043/237*
(100/100) |
5565/215
(92/91) |
127/6
(2/3) |
351/16
(6/7) |
| Kentucky
non-Appalachian |
10481/394
(100/100) |
376/15
(4/4) |
9721/361
(93/92) |
384/18
(4/5) |
| Kentucky
Metropolitan Areas |
12160/465
(100/100) |
923/37
(6/8) |
1525/62
(13/13) |
9692/366
(80/79) |
| Out-of-state |
19384/553
(100/100) |
1114/56
(6/10) |
2402/107
(12/19) |
15868/350
(82/71) |
* amount of deposits in $million/number of offices
Sources: see Table 1
Figure 3
Regional Distribution of Institutional control
6. Summary and concluding remarks
This research finds that the depository institutions in Kentucky demonstrate
distinct regional patterns in market structure and in the structure of
corporate control. In terms of market structure, Appalachia counties in
Kentucky are the most concentrated, followed by rural non-Appalachian and
metropolitan counties. The disadvantage in Appalachian banking lies more
in insufficient funds than in banking locations. In contrast, the advantages
in metropolitan counties are in ample funds rather than in convenient locations.
In addition, rural non-Appalachian enjoy ample amount of funds as well
as convenient locations. In terms of the structure of corporate control,
Appalachian counties as a whole are least affected by outside institutions
including out-of-state institutions as well as metropolitan institutions.
Metropolitan markets are most influenced by out-of-state institutions.
Rural non-Appalachian counties are in an intermediate position. All these
observations suggest a more concentrated and closed financial market in
Appalachia than in the other two regions.
The above conclusions point to the direction for the next phase of investigation
that should focus on whether the growth problems in Appalachia relate to
their more concentrated and closed financial markets, as suggested by standard
macroeconomic theory. Specifically, the regional lending pattern should
be investigated in the context of market structure and the structure of
ownership. In addition, the regional growth pattern should be investigated
in the context of regional lending pattern as well as the regional market
and ownership structure. It may seem too early to offer policy implications
at this stage of the investigation. However, given the fact that most Asian
economies have finally started to turn around after significant financial
restructuring, among other changes, policies that are designed to strengthen
the financial market in Appalachia and make it more competitive and open
may be a positive step toward solving regional growth problems.
7. References
1. Amos, Jr. O.M. 1992. The Regional Distribution of Bank Closings in
the United States from 1982 to 1988. Southern Economic Journal 58
(3): 805-815.
2. Appalachian Regional Commission. 1997. 1997 Annual Report.
Washington, D.C.: Appalachian Regional Commission.
3. Bradshaw, M. 1992. The Appalachian Regional Commission: Twenty
-Five Years of Government Policy. Lexington KY: University of Kentucky
Press.
4. Harrigan, F.J. and P.G. McGregor. 1987. Interregional Arbitrage and
the Supply of Loanable Funds: A Model of Intermediate Financial Capital
Mobility. Journal of Regional Science 27(3):357-367.
5. Lord, J.D. 1992. Geographic deregulation of the U.S. Banking Industry
and Spatial Transfers of Corporate Control. Urban Geography, 13(1):25-48.
6. -----. 1990. Impact of Banking Acquisitions on Local market Concentration
in Florida. Southeastern Geographer, 30 (1): 1-16.
7. Miller, R.J. 1978. The Regional Impact of Monetary Policy in the
United States. Lexington MA: Lexington Books.
8. Raitz, K.B. and R. Ulack, 1984. Appalachia: A Regional Geography.
Boulder CO: Westview Press.
9. Rhoades, S.A. 1996. Bank Mergers and Industrywide Structure, 1980-1994.
Staff
Study 169. Washington D.C.: Board of Governors of the Federal Reserve
System.
10. Whalen, G. 1995. Out-of-State Holding Company Affiliation and Small
Business Lending. Economic & Policy Analysis Working Paper 95-4.
Washington D.C.: Comptroller of the Currency.